Nudge APM has an alerting engine that can inform of any failure in a proactive way.
Alerts can be set up fomr the Alerts main menu.
An alert is configured with these informations:
- the scope of the control (what application? What transaction? …),
- the metrics to be checked and the threshold of the requirement (x seconds of response time, error rate, …),
- the kind of notification (e-mail, webhook)
- the period and analysis conditions
Nudge APM provides a wizard that will let you set all these informations.
General Information
This screen let you specify the kind of notification and what metrics to be observed.
Notification
You have two kinds of notifications: by e-mail or by webhook.
-
In case of notifications by e-mail you simply have to set the list of the addresses.
-
Webhooks are http messages that the alerts engine can send to third party services such as Jira, Slack, SMS broker…
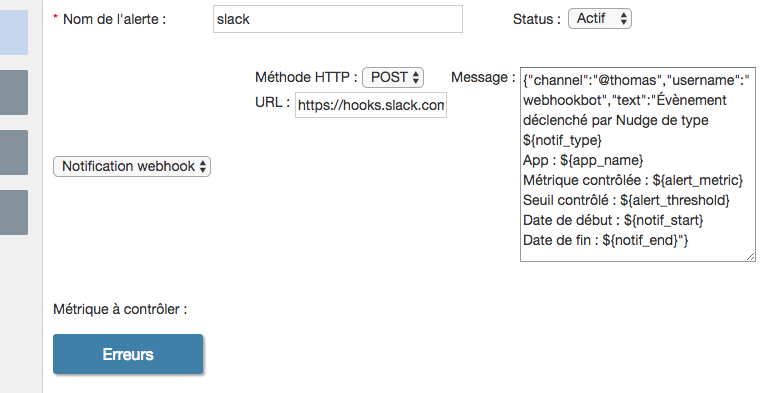
Webhooks are configured with two or three parameters depending on the case:
- the kind of HTTP method: POST, GET or PUT
- the URL of the service that will receive alert messages
- the format of the message to be sent (this field is available only for the methods POST or PUT)
Messages are sent with a application/json content type.
Informations on the alert, or others informations related to it can be placed inside the URL or the message. The parameters that are placed inside the URL will be url-encoded.
This is the list of the parameters available:
${notif_desc}: description of the notification${notif_type}: type of the notification (example: at the beginning of alert, at the end of alert)${notif_start}: start timestamp up of the notification${notif_end}: end timestamp of the notification${alert_metric}: checked metric (time of answer, number of errors)${alert_threshold}: threshold of release of the control${transaction_name}: name of the transaction (depending on configuration, this information may be not available)${server_name}: name of the service where the threshold has been exceeded (depending on configurations, this information may be not available)${app_name}: name of the application
Example:
Here are some examples of configurations for specific tools:
- Slack
- Http method:
POST - URL:
https://hooks.slack.com/services/slack-keys - Message:
{"channel":"#nudge","username":"webhookbot","text":"Alerte Nudge : ${notif_desc}"}
- Http method:
- JIRA
- Http method:
POST - URL:
https://jirauser:jirapassword@yourdomain.jira.com/rest/api/latest/outcome - Message:
{"fields":{"project":{"key":"PROJECT-KEY"},"issuetype":{"Issue"},"description":"${notif_desc}","summary":"${alert_metric} not matching threshold ${alert_threshold}"}}
- Http method:
- Primotexto (sending of SMS)
- Http method:
GET - URL:
https://api.primotexto.com/v2/notification/messages/send?ApiKey=YOUR_API_KEY*identifier=YOUR_NUM$BER*sender=YOUR_SENDER*message={notif_desc}
- Http method:
Metrics
Choose the metrics to control:
| Entity | Metric | Description |
|---|---|---|
| Application | Mean resp. time | Mean response time |
| Application | Errors | Number or rate of errors |
| Application | Satisfaction | Satisfaction index |
| Service | Outage | Service stopped to send data |
| Service | JMX | MBean JMX Attribut’s (only Java) |
The apdex is available in two contexts:
- the satisfaction index can be controled by itself with the Satisfaction metric
- the threshold of response time can be defines with configured satisfying or tolerable APDEX threshold on a Mean resp. time metric
Threshold
The content of the threshold screen depends on the metric. Elements to use as reference to evaluate the threshold and also its units available will depend on the kind of metric to control. For instance, a response time is comparable to a duration in seconds, an error rate is comparable to a percentage …
Trends
Depending on the nature of the measures, it is somettime possible to use a threshold based on the evaluation of a trend.
This kind of control let you detect the degradation of measures from what used to be measured previously.
The relevance a trend depends on the seasonality of the measures: if the historical measures are very volatile, this kind of control risks to raise a lot of alerts.
To compare a measure to its trend, the alerting engine first estimates the trend. It does this by grabing previous measures in a previous comparable period depending on the seasonality (daily, weekly …) which is defined in the alert configuration.
The trend is multiplied by a coefficient of deterioration tolerance to obtain the threshold of the control.
Example:
Let’s imagine a transaction which has a weekly seasonal performance. In that case the trend cill depend on measures observed around one week ago.
We position the following parameters:
- Gap of one week,
- Window of 30 minutes,
- Tolerance of degradation of 1.5.
The threshold for the control of an event which was observed at 11:52 am on 13/01/2017, will be evaluated with measures observed on 06/01/2017 between 11:37 am and 12:07 am multiplied by 1,5.
Scope
This screen let you choose wich element has to be controled.
As an example, here is some combinations for the response time control:
- an whole application without distinction of transaction: in this case the measures that will be ckecked is the response time of every transaction of the applciation
- a transaction or a set of transactions: in this case transactions will be individually analyzed
Conditions of analysis
Period of analysis
Define here the period during which the control has to be effective.
Analysis time frame
Instead of considering any measure alone (that could raise lots of alerts), the alerting engine consider measures observed in a time frame previously to any event analysed.
By default the wizard proposes 5 minutes and 80 %, it means that when the alerting engine will control the measure of an event, it will consider every measures of the 5 previous minutes and it will raise an alert only if the threshold is exceeded on at least 4 of these 5 minutes.
Has an exemple, let’s consider a threshold of 2 on a given metrics, this it what will happend on several sequences of measures:
- 1.5, 2.1, 2.2, 3.0, 2.5 => the threshold is exceeded 4 minutes, if the alert is not already raised, it gets raised
- 2.1, 2.2, 1.0, 3.0, 3.0 => the threshold is exceeded 4 minutes, if the alert is not already raised, it gets raised
- 1.5, 2.1, 2.2, 3.0, 1.5 => the threshols is exceeded only 3 minutes, if the alert is currently raised, it gets stopped