ElasticSearch / « HEAD » graphic plugin
Installation
Prerequisites:
- Minimum of Java 6 on the machine that will host elastic search.
- To check on the of and the Java version, open your terminal and type in the following commands:
Verification command ligne (only under windows and unix):
$ java –version
The result should be similar to this: (if the java version is superior to 1.6 then all is good.)
java version “1.x.x” Java(TM) SE Runtime Environment (build 1.6.0_25-b06)
Elasticsearch download
Elasticsearch is downloadable under the form of a zip archive, tar.gz or under a package .deb form.
You only need to go to the following address and start the needed download:
.zip: for the windows version.tar.gz: for linux or mac.deb: pour debian for debian
$ unzip elasticsearch-*.*.*.zip/tar.gz
After unzipping:
- bin, (contains the elasticsearch launch script)
- config, contains the elasticsearch configuration file (elasticsearch.yml) as well as the logs one.
- lib, contains the librairies used by elasticsearch.
Starting Elasticsearch
You just need to go in the « bin » file previously presented and launch the following command.
$ cd elasticsearch-..*/
# we enter in the elasticSearch file
$ cd bin
# We enter in the bin file
$ ./elasticsearch # start up elasticsearch
At the start-up, ElasticSearch will create new repertoires:
- data, intended for the indexed data
- logs, containing the logging files
- work, contaning the temps files requested of its good operating mode
In order to make sure Elasticsearch started-up well, go to your elasticsearch host URL. By default:
By default Elasticsearch listens to the 9200 port in order to answer to potential requests.
If your Elasticsearch is working well you should have:
{ “name” : “Myron MacLain”, “cluster_name” : “elasticsearch”, “version” : { “number” : “2.2.0”, “build_hash” : “8ff36d139e16f8720f2947ef62c8167a888992fe”, “build_timestamp” : “2016-01-27T13:32:39Z”, “build_snapshot” : false, “lucene_version” : “5.4.1” }, “tagline” : “You Know, for Search” }
This result is in JSON and sends back the elasticsearch status.
The server has then started-up
Stage 3:
The graphic interface via the Head plugin
The head plugin:
This plugin provides a graphic interface to Elasticsearch, allows an easier administration as well as an interaction with the clusters
Set-up (2 methods)
Method 1 :
$ cd elasticsearch-..* $ bin/plugin install mobz/elasticsearch-head –verbose
Method 2:
$ cd elasticsearch-..* sudo elasticsearch/bin/plugin install mobz/elasticsearch-head
Elasticsearch start-up via head
You just need to start-up Elasticsearch as you usually do, via:
$ cd bin $ ./elasticsearch
The URL is the only change with the addition of « /_plugin/head/ »:
http://localhost:9200/_plugin/head/
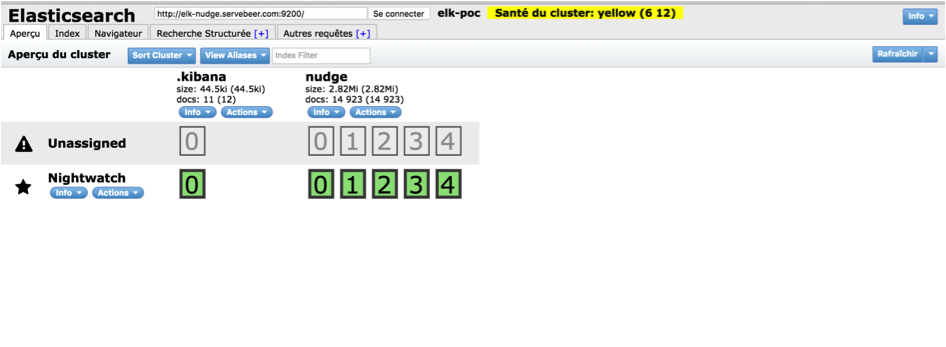
Setting up of Kibana
Kibana, belonging to the same Elastic stack, follows the same set-up and start-up as Elasticsearch.
Kibana download
Go to the following URL:
Choose the archive matching your operating system and unzip it.
Starting Kibana
$ cd kibana-..*/
# We enter in the unzip kibana file
$ cd bin
# We enter in the bin file
$ ./kibana
# start up kibana
Once Kiaban is started, go to the following URL. The one conifgured by default.
You can of course configure a new one in config/kibana.yml, like elasticsearch.
You will get the following page:
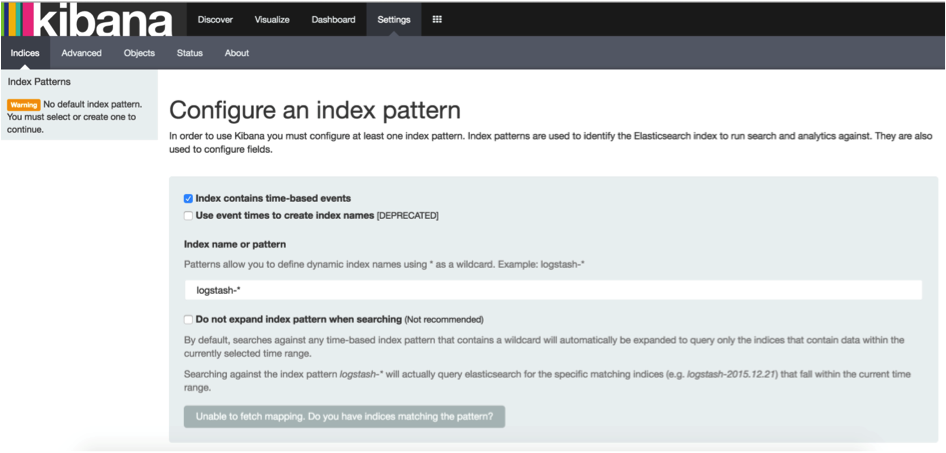
Congratulations. You kibana is ready to use !
Nudge apm : ELK plugin documentation
Docs : Nudge elastic stack connector
The Nudge-elasticstack-plugin was developped in order to facilitate the developpers and production teams work.
Indeed, settled in the DevOps world , Nudge is a company specialised in the APM solution (Application Performance Management), and integrates via its REST API , an unavoidable duet of the elastic stack :
ElasticSearch and Kibana
Through the plugin, directly plugged on the Nudge API, it will then be possible to use this stack in order for the developers to easily indentify the bugs detected by the Nudge Agents, and work within Kibana, a flexibile and attractive interface.
Prerequisites:
Amongst Nudge:
In order to use the Nudge connector, you have to be registered as a user on the Nudge website and have in your possession:
- Your login
- Your password
- The application ID
You will then have access to application data requested and analysed by the plugin.
If one or several of these 3 criterias is no filled in , follow the following procedure:
Registration:
If you’re not already registered, the procedure is simple and free.
It will allow you to use the connector’s full potential.
In order to do so, all you have to do is go to the website site home page at this address:
Then clic on « Demo/registration », and fill in the form. You will then have your login and password.
Retrieving the application id.
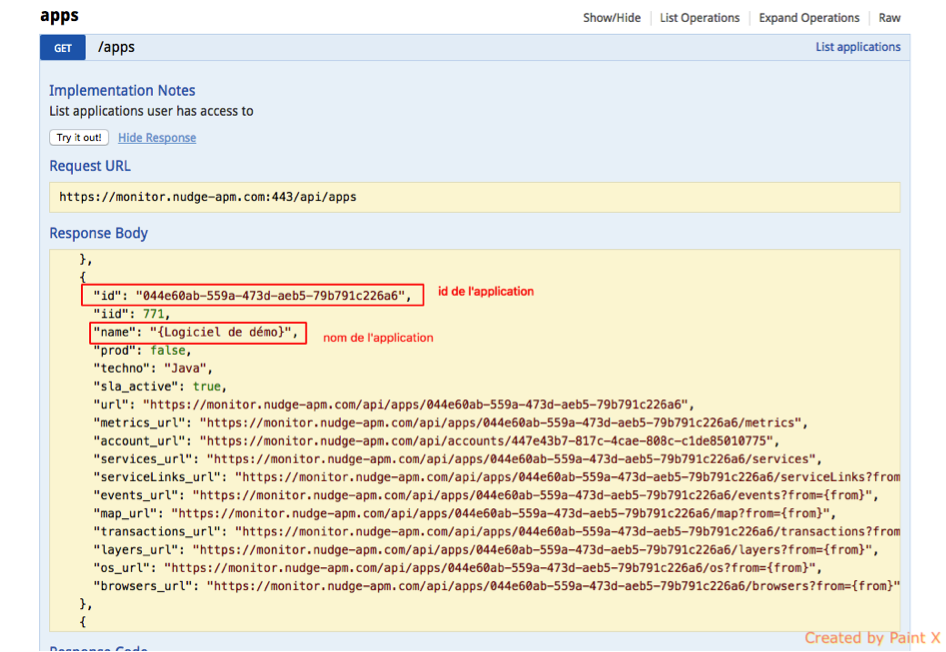
You will need the application ID. You will findit on the API and by executing:
Apps / Get /apps / try it out
As follows:
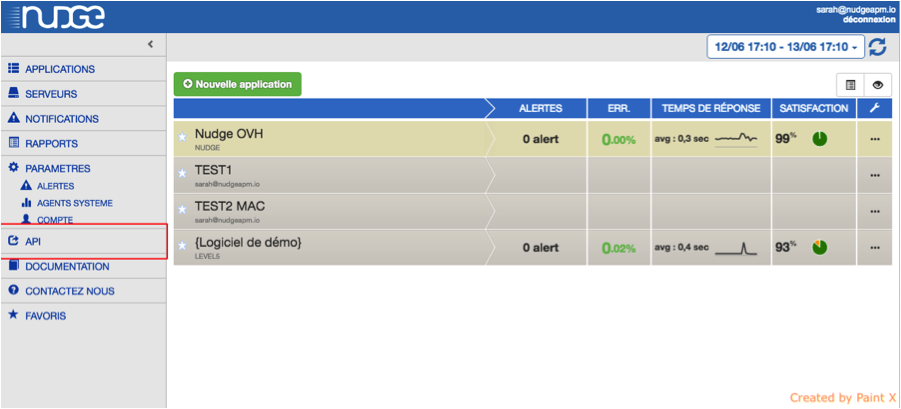


Following this, you will able to retrieve your application ID, refering yourself to the « response body »:
Amongst the elastic stack
It’s compulsory you have:
- Elastic search version 2.3 or above
- Kibana version 4.5.0 or above
These are availble for download at:
Amongst the work environment
The platforms:
- Windows
- Mac
- Linux
Only the demo script is being developped under windows. Although very usefull, it isn’t essential to the good use of the plugin.
Java:
You will also need to have java on the machine which the plugin will be executed on.
The java version needs to be 7 or above.
To check the installed version, open your terminal and and type:
$ java –version
Download:
To start with, you have to download the zip file on Github:
https://github.com/NudgeApm/nudge-elasticstack-connector/releases
And unzip the archive:
$ wget https://github.com/NudgeApm/nudge-elasticstack-connector/releases/download/v1.0.0/nudge-elasticstack-connector-1.0.0.zip
$ unzip nudge-elasticstack-connector-1.0.0.zip
It includes:
- A script.sh file
- A useful to the script dash file
- An execution jar
Beware:
The jar that will be executed will have to be next to the configuration file.
Execution:
Configuration:
First of all, make sure the Elasticsearch and Kibana services are started.
If they’re not the plugin won’t be able to indexe the data.
The configuration file, placed next to the JAR, has to be edited in order for you to insert your login, password and the application id.
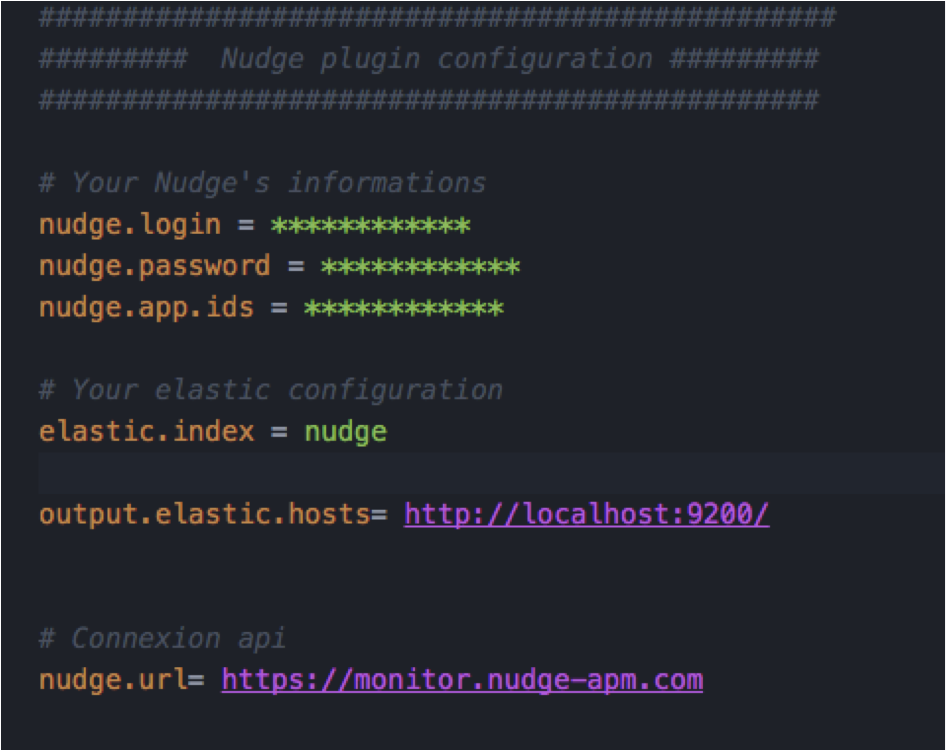
Start the connector
The connector constantly requests all the data regarding your application.
Every minute, the data will be sent to Elasticsearch.
The command to launch the connector service is the following:
$ java-jarnudge-elasticstack-connector-1.0.0-jar-with-dependencies.jar -startDaemon
The Elastic Stack and the connector
After the connector’s good execution, you create in your ElastcSearch an index named « nudge »(or another name if you have modified the index name in the configuration file).

In Kibana, please go to « settings » in order to set up the index-pattern.
You have to fill in the index in ElasticSearch (Here in will be Nudge)
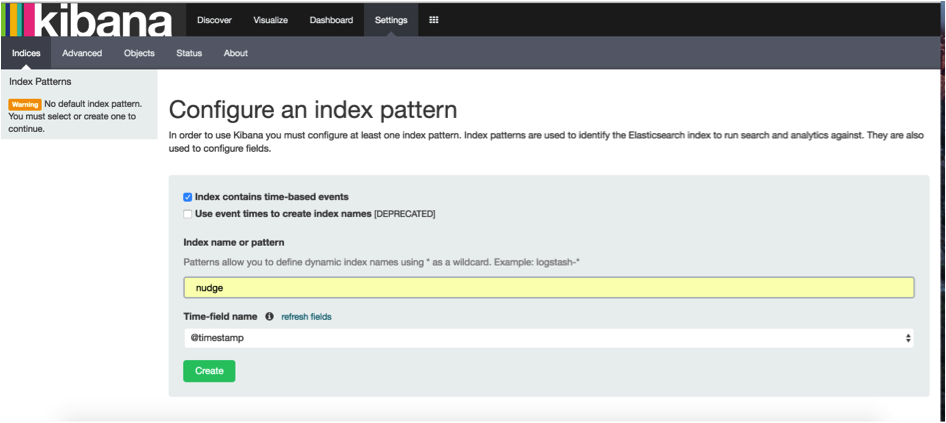
Congratulations ! You can now create your displays and dashboards !
The script : kibana_init_dashboards.sh
In the .zip you have downloaded is a script file
It acts as a demonstration and allows you to better apprehend what can be generated and done through the plugin.
It directly imports displays and related dashboards.
They’re based on the nudge demonstration software data accessible once you’re registered on the website.
This script execution is vital to understand and analyse the way the Nudge data can be exploited, but also to generate your own displays or dashboards in an simple way.
Prerequisites:
Amongst Nudge:
The execution of the connector is requested prior to the use of the script.
Through it the script will collect the Nudge application data.
Amongst the environment:
The only difference worth mentioning, is that it’s being developped in order to be usable under windows.
Script configuration:
The script was developped so that you don’t have any particular configuration to do prior its execution.
However, the only configuration that you can do without impacting its original use, is the Elasticsearch and Kibana host change.
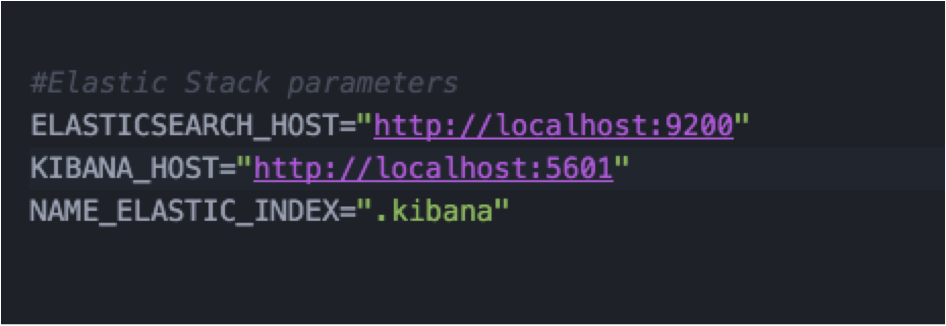
Any other modificaion may impact how the script operates.
Had you replaced the « elastic.index » field by another name in the plugin configuration, put back « nudge ».
This index will be then created amongst your elasticsearch (see the section related to the plugin for more information), and will allow the import of the displays and dashboards.
Script use
Script launch or start-up
Open your terminal, go to the root file containing the .sh file and execute the script with this command.
$ ./kibana_dashboard_init.sh
If you get an error message:
$ bash : ./ kibana_dashboard_init.sh : Permission denied
Do the following:
$ chmod +x kibana_dashboard_init.sh $ ./kibana_dashboard_init.sh
You should find the following options displayed below useful:

For a first use, all you need to do is run the following command
$ kibana_dashboard_init.sh import
This will import all the displays and dashboards available.
The elastic stack and the script.
This script execution with the import parameter will have several effects:
- The creation of a « .kibana » in your elasticsearch. It contains the indexation of the different displays and dashboards:

- The automatic creation of the « nudge » index-pattern in kibana.
Please note that this automatic creation does not affect you if you have already configured your index-pattern as « nudge » when setting-up the plugin.
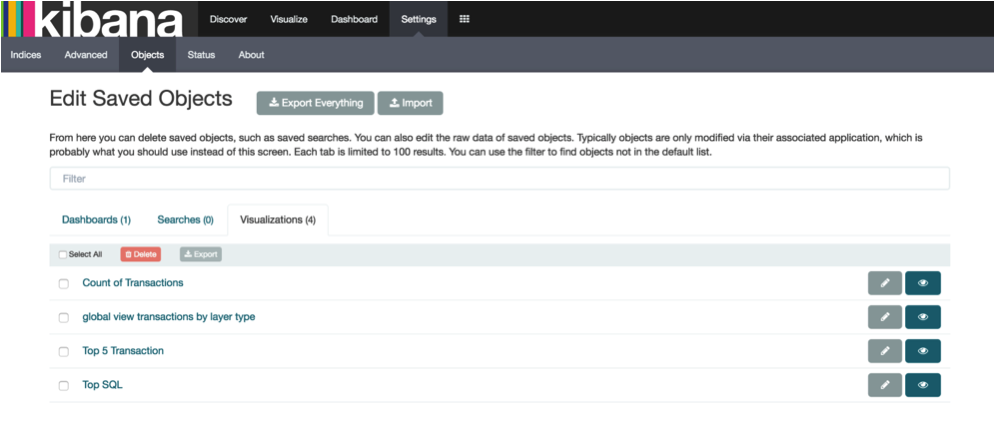
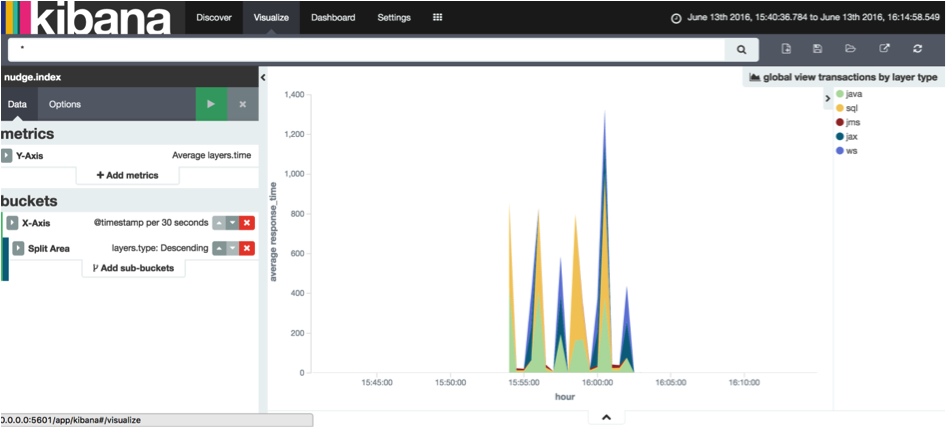
- Access to the Nudge displays without any other configuration to do:
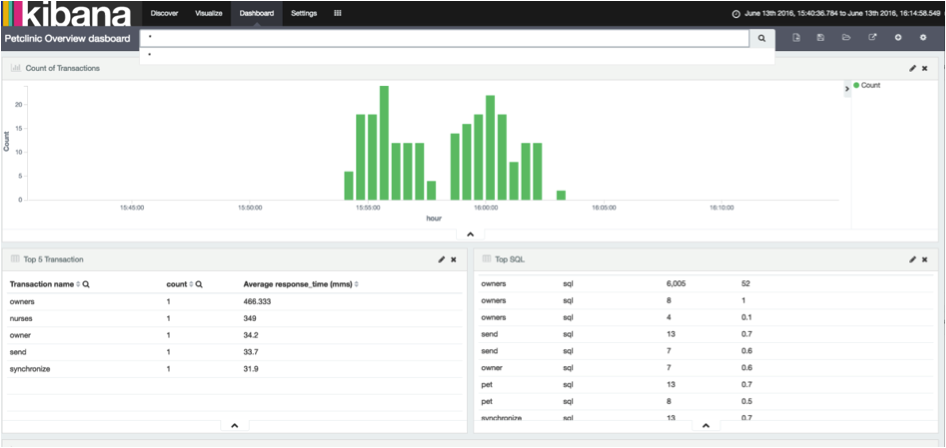
- Access to the different dashboards automatically generated by the displays
Imports deletion:
You have the possibility to delete the imports, either via ElasticSearch or in Kibana.
In order to do so, you have to launch the script with the options available in the help section.
You will have the following choices:
$ kibana_dashboard_init.sh delete_all
or
$ kibana_dashboard_init.sh delete_visu
or
$ kibana_dashboard_init.sh delete_dash
- delete_all: Will erase the entirety of the imports
- delete_visu: You will be able to enter the name of the displays you wish to delete.
- delete_dash: You will be able to enter the name of the displays you wish to delete.

Enjoy the running !