- Map
- Business transactions monitoring
- Profiling
- Errors
- User vision
- User behaviour
- SQL monitoring
- System monitoring
- User Satisfaction
- Alerts
- REST API
- X Apps
- Reports
- LDAP integration
Map
Interactions between monitored services and surrounding components are displayed as map in the Map tab.
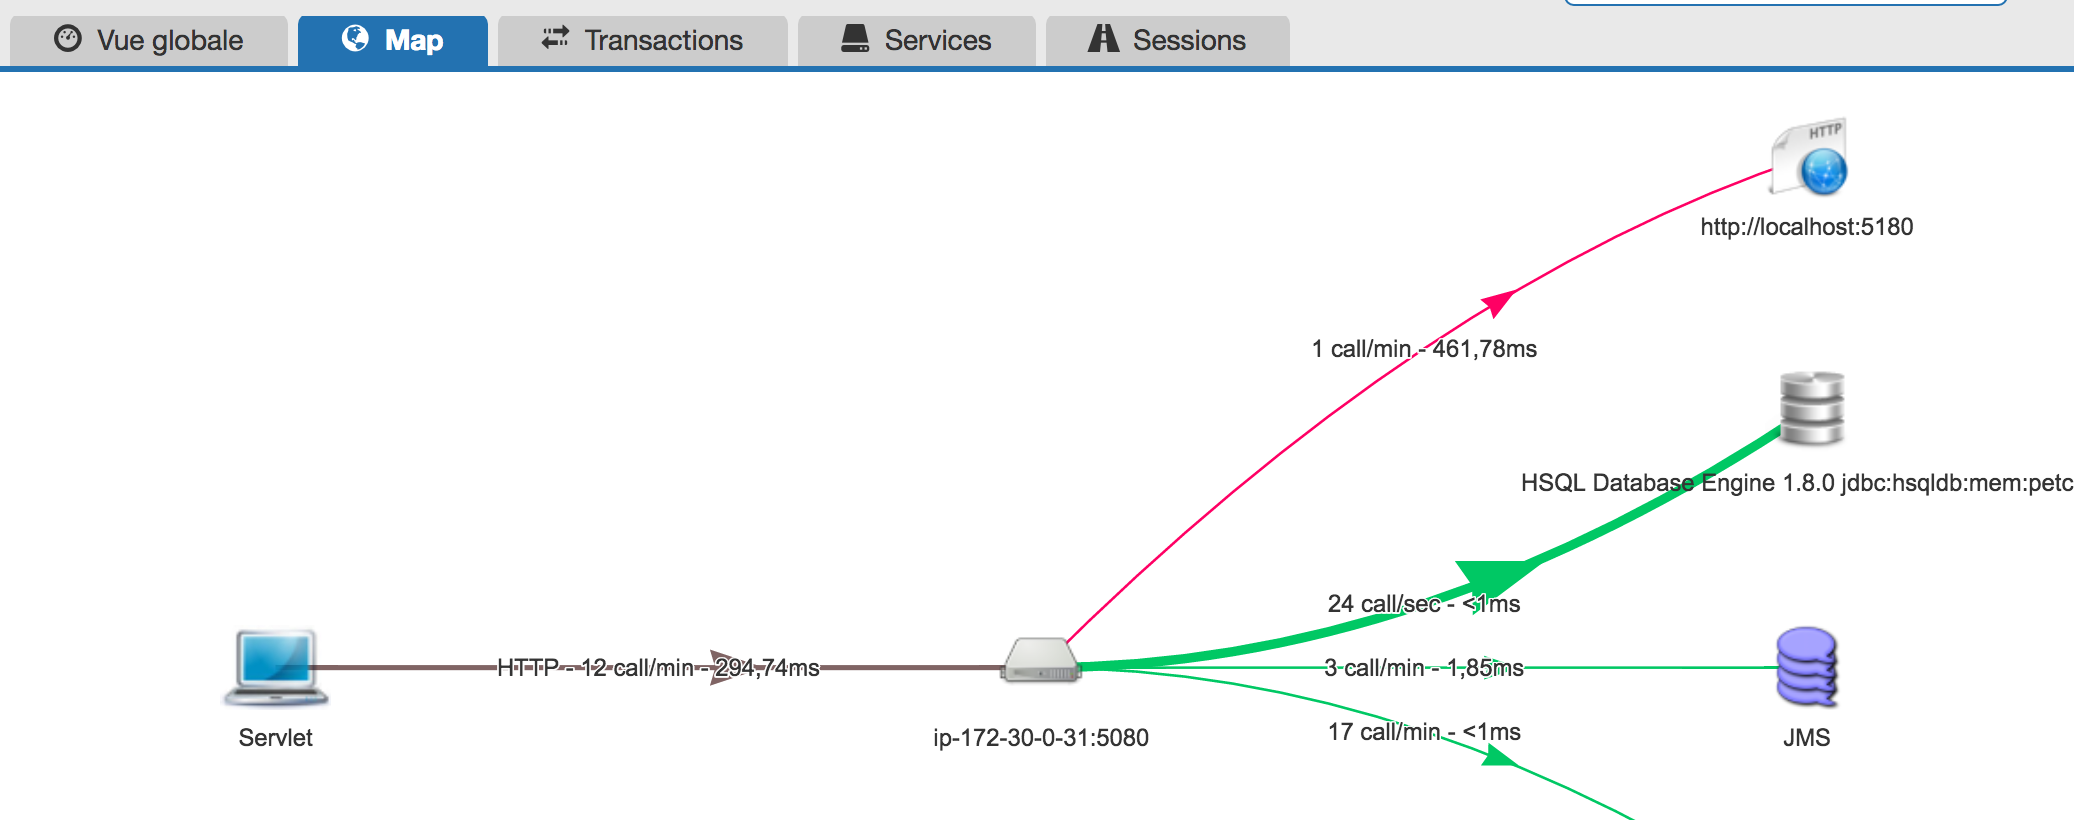
The map is composed of three horizontal parts :
- On the left, the entry points: technologies that serve the transactions. The name are more or less precise depending on the technology : HTTP, WS, Servlet, RMI …
- In the middle apprears monitored services. If the application is a cluster of services, one component appears for each service of the application.
- On the right apprears external componants involved while executing transactions (databases, web services …).
The links thickness and color depends on the importance of the link compared to all links. The thickness depends on the transaction count and the color on the mean latency.
The links between entry points and the application services are incoming transactions. The links bewteen the application services and external componants are outgoing transactions.
It is possible to view the evolution of the number of incoming and/or outgoing transaction count and latency of any element of the map just by selecting it.

Business transactions monitoring
Stop guessing, monitor all your business transactions.
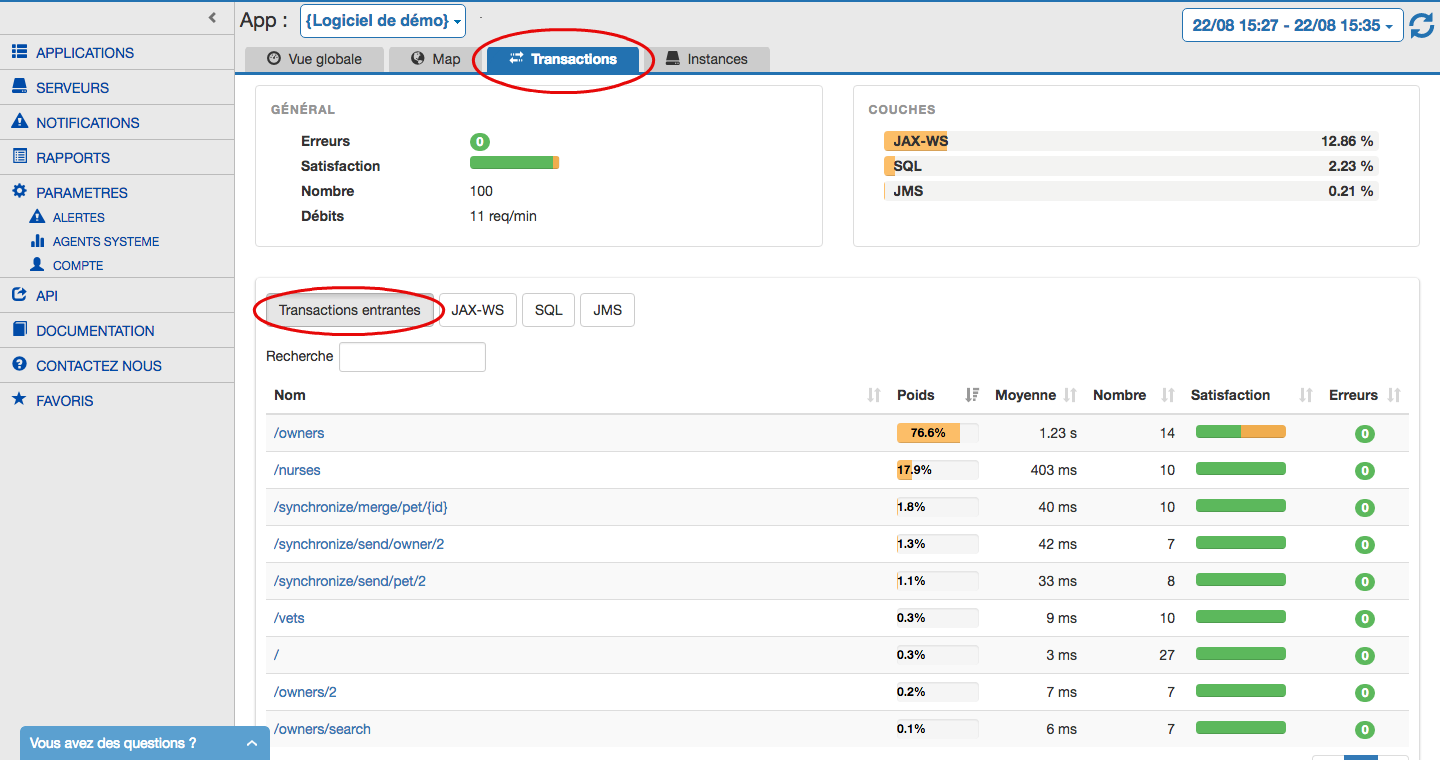
Thanks to the data collected by our agents in all software layers (database, remote calls, …), Nudge-APM brings a precise (inner and outer) view of all business transactions and their behaviors over time.
Having such information, you get able to:
- to diagnose and solve quickly technical issues and incidents
- to detect performance slowdowns (potentially for particular transactions)
- to identify features that impact the application overall performance
Profiling
Deep dive into the code
Nudge APM is a monitoring and a troubleshooting tool that allows you to have an in-depth view of your applications. It points out all the hotspots and bottlenecks in your code.
Slowdowns or errors are visible straightaway, you discover at a glance the related code and you can even have a detailed view of the involved methods/functions of your codebase using our profiling.
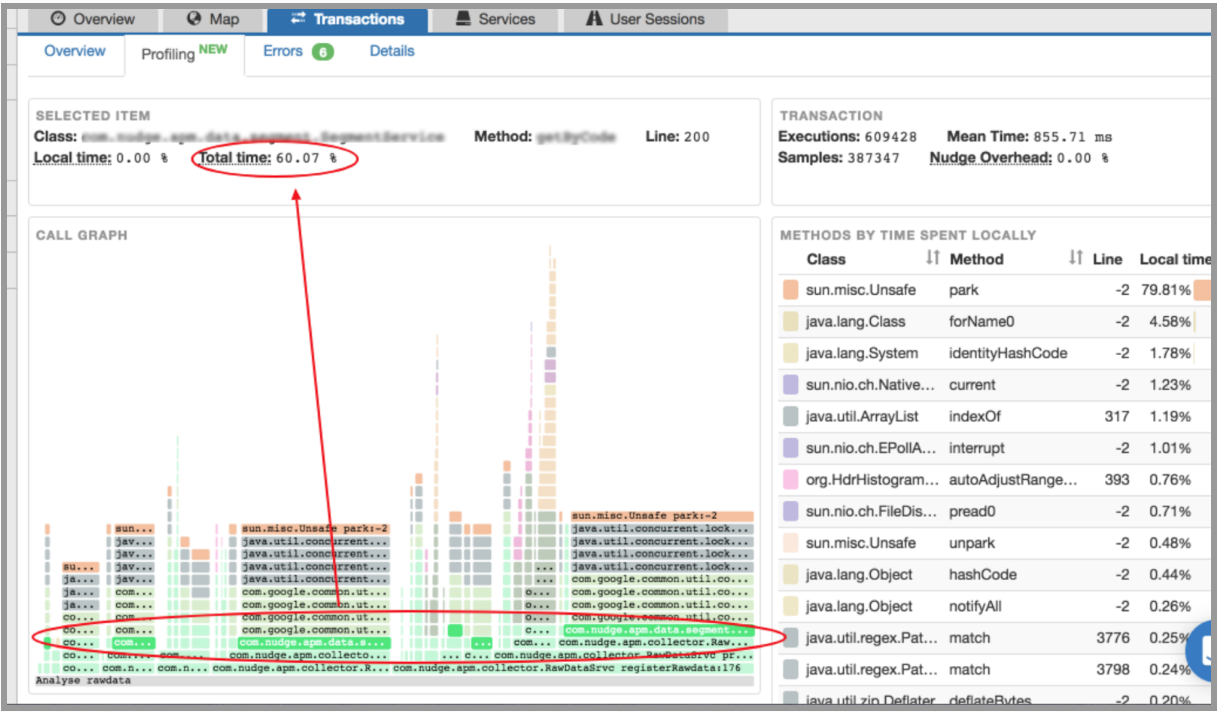
You get a rendering of stacktraces and each method/function in which most of the time is spent represented either in a graph and a detailed dashboard:
- A visual graph to catch at a glance the time spent in each method (graph is split by executed method. A larger block represents a longer time spent)
- The location in the code (class name, method/function name, line number)
- Local Time = time spent locally in the method, meaning not calling another method
- Total Time = Total added up time of the method execution including time spent calling other methods
- Total executions of the business transactions with mean time, Total of samples (recorded occurrences of that element during runtime), and probe overhead
- Details of selected item (method)
Around 1% overhead. It has the lowest overhead of the market. It uses sampling for the retrieval of stacktraces in order to lower the impact on the host. It makes it then important to use this feature in production environments (unlike classic profilers).
Furthermore, it does not require any change in the source code.
Profiling additional information:
- Global information on the business transaction:

- Transaction’s executions volume
- Mean execution time
- Number of samples
- Nudge Overhead
- Dashboard - Detail of time spent in each Method:
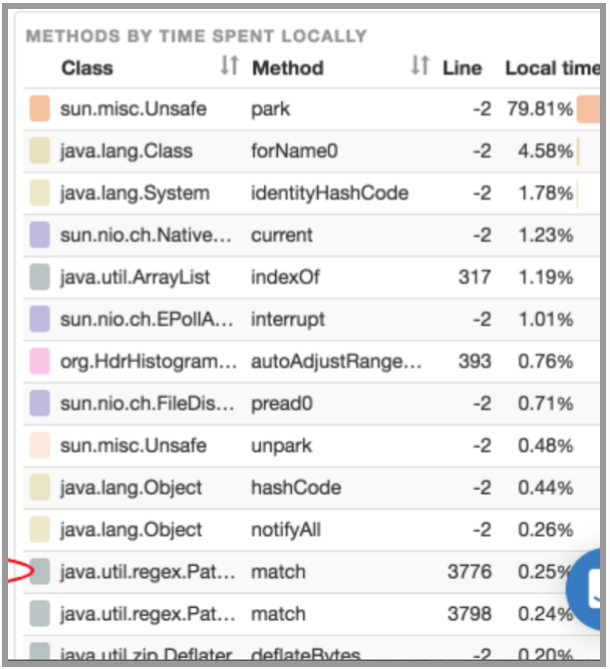 At a glance, you can have a direct eyesight of which part of code is slowing down your App.
Method ordered by time spent (editable) and their impact on the global response time:- Class
- Method
- Code line
- Method time spent
- L’impact d’une méthode sur l’ensemble de la transaction
 Very user friendly eyesight of the impact of a method in your business transaction.
By clicking in the graph on a method, you will have the detail of the selected item:- Class involved
- Method
- Code line number
- Local Time = time spent locally in the method, meaning not calling another method
- Total Time = method treatment total added up time including time spent calling other methods
The profiling is currently only supported with the Java agent.
Errors
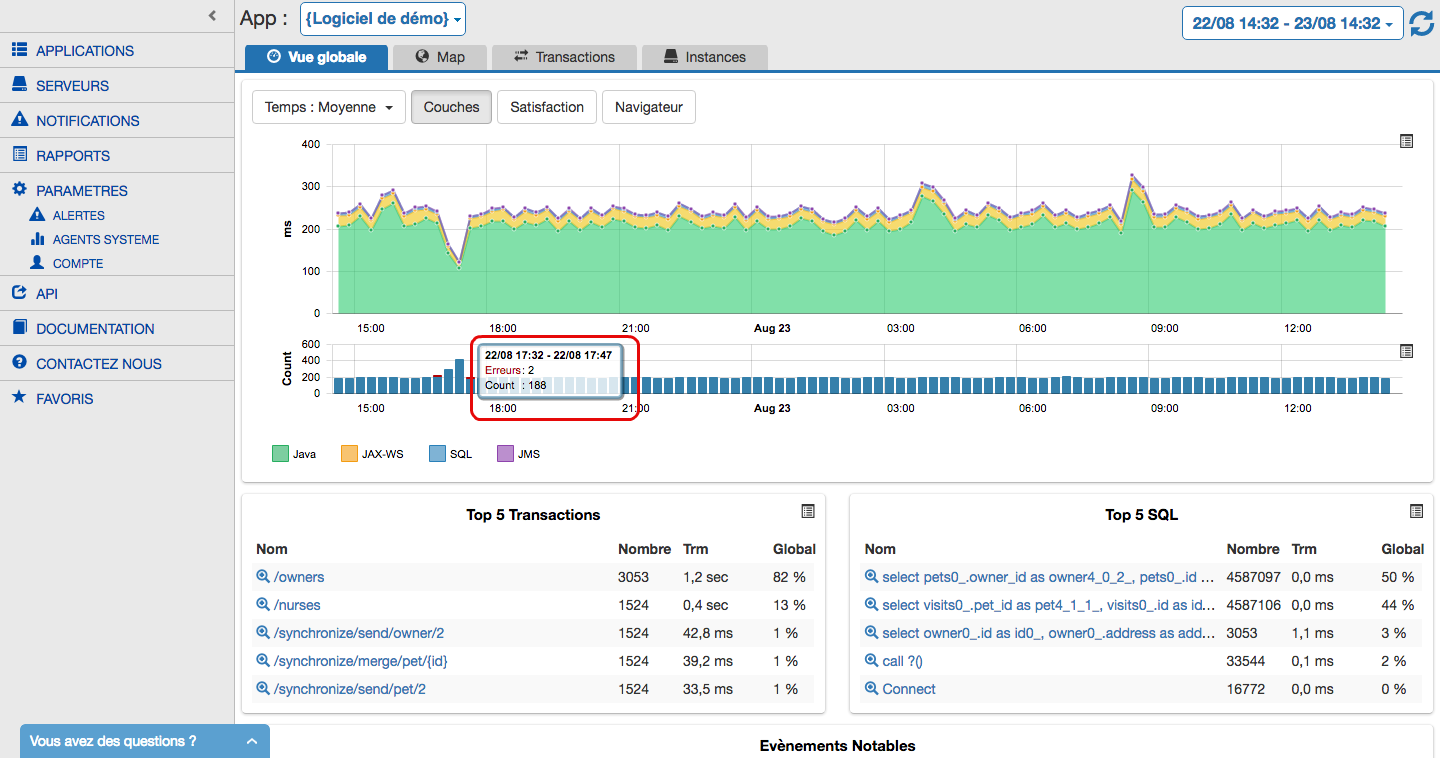
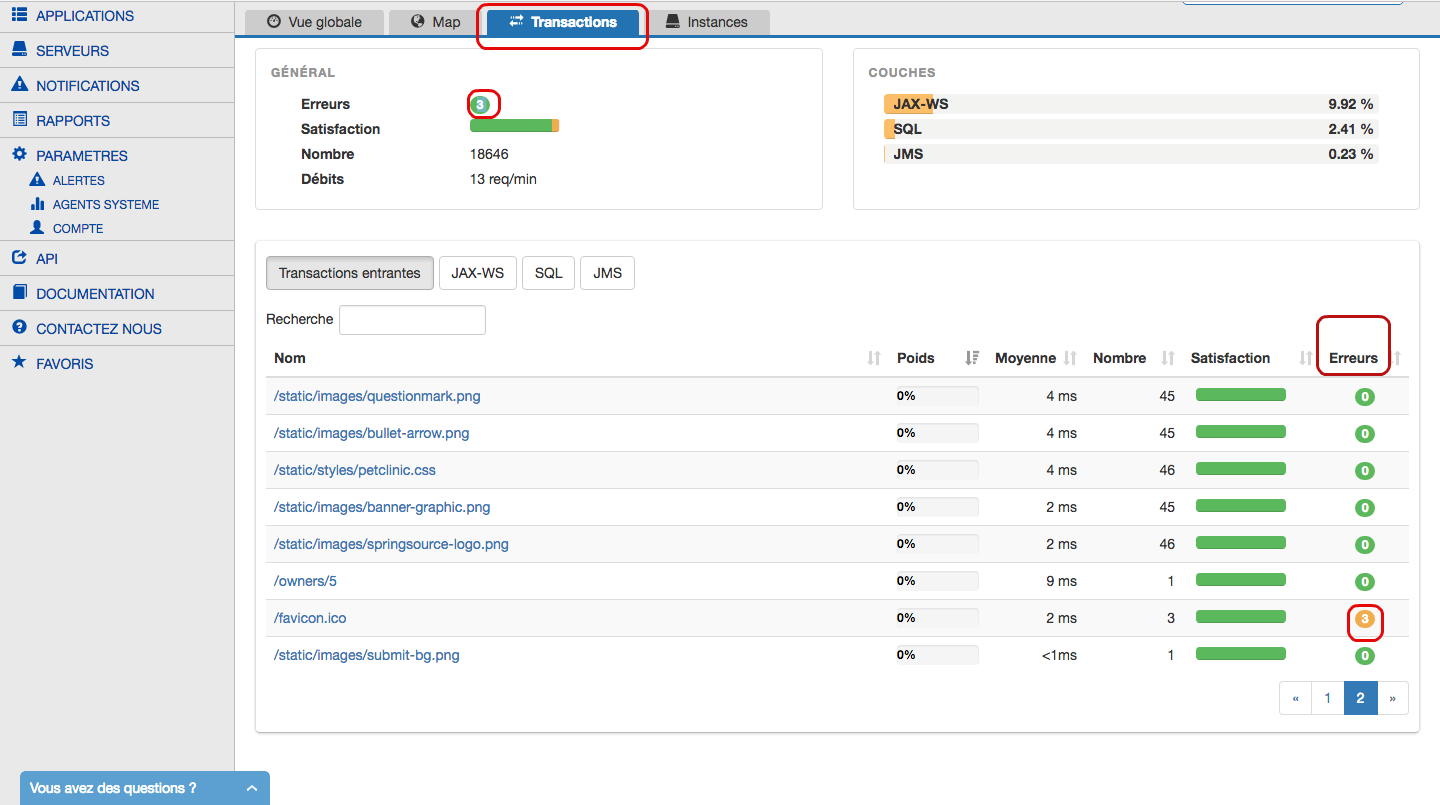
The Nudge APM agent not only analyzes the response times of transactions, it also qualifies the transactions in respect of their success or failure.
In order to help the diagnosis of the failures, the probe retrieve the available contextual information at the time of the incident. With Java, it refers to the stacktrace of the potential exception and to its causes.
The errors and their causes can be seen from the transaction’s tab after choosing the corresponding transaction. The screen represents a distribution of errors in time. It groups the errors by their nature (http code, class of exception, …). You are able to visualize the complete stacktrace of the exception and its causes.
User vision
The Nudge APM agent has an option allowing to inject some Javascript code in pages that are generated by the application in order to measure the load of the page from the user’s browser perspective. It makes possible to record performance as it’s perceived by the user. That information is based on the standard API HTML5 Navigation Timing. The Javascript code is harmless for the not compatible browsers HTML5.
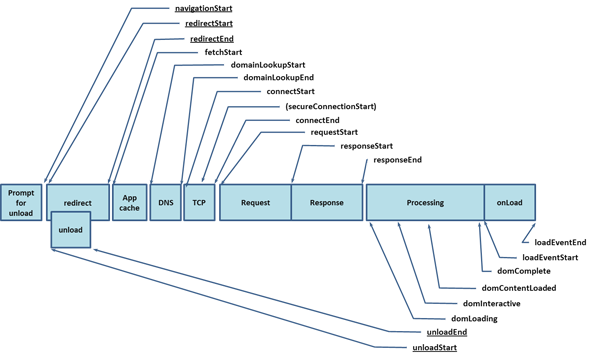
Nudge APM is going to allow to visualize (display) the following metrics collected on the browser:
- Duration of redirect ( HTTP code 302 )
- Duration of the calls DNS
- Duration of the connection TCP
- Duration of the request HTTP/HTTPS
- Duration of the answer HTTP / HTTPS
- Duration of the treatment DOM
- Duration the event onLoad
The gathering of such metrics is handled by the Java agent when using particular technologies related with web pages development.
User behaviour
You are able to follow user’s navigation in your application (from the beginning to the end of a session), so that you can:
- Understand a specific user context in order to troubleshoot very precisely a performance issue,
- Analyze user’s behavior to detect behavioral anomalies (data is available through our REST API in order to do “analytics”),
- Optimize application server parameters to fit your users need,
- Help your IT teams get closer to your Business and Marketing teams. Make use of APM data to understand your users behavior and habits (Technical data is getting closer to Marketing).
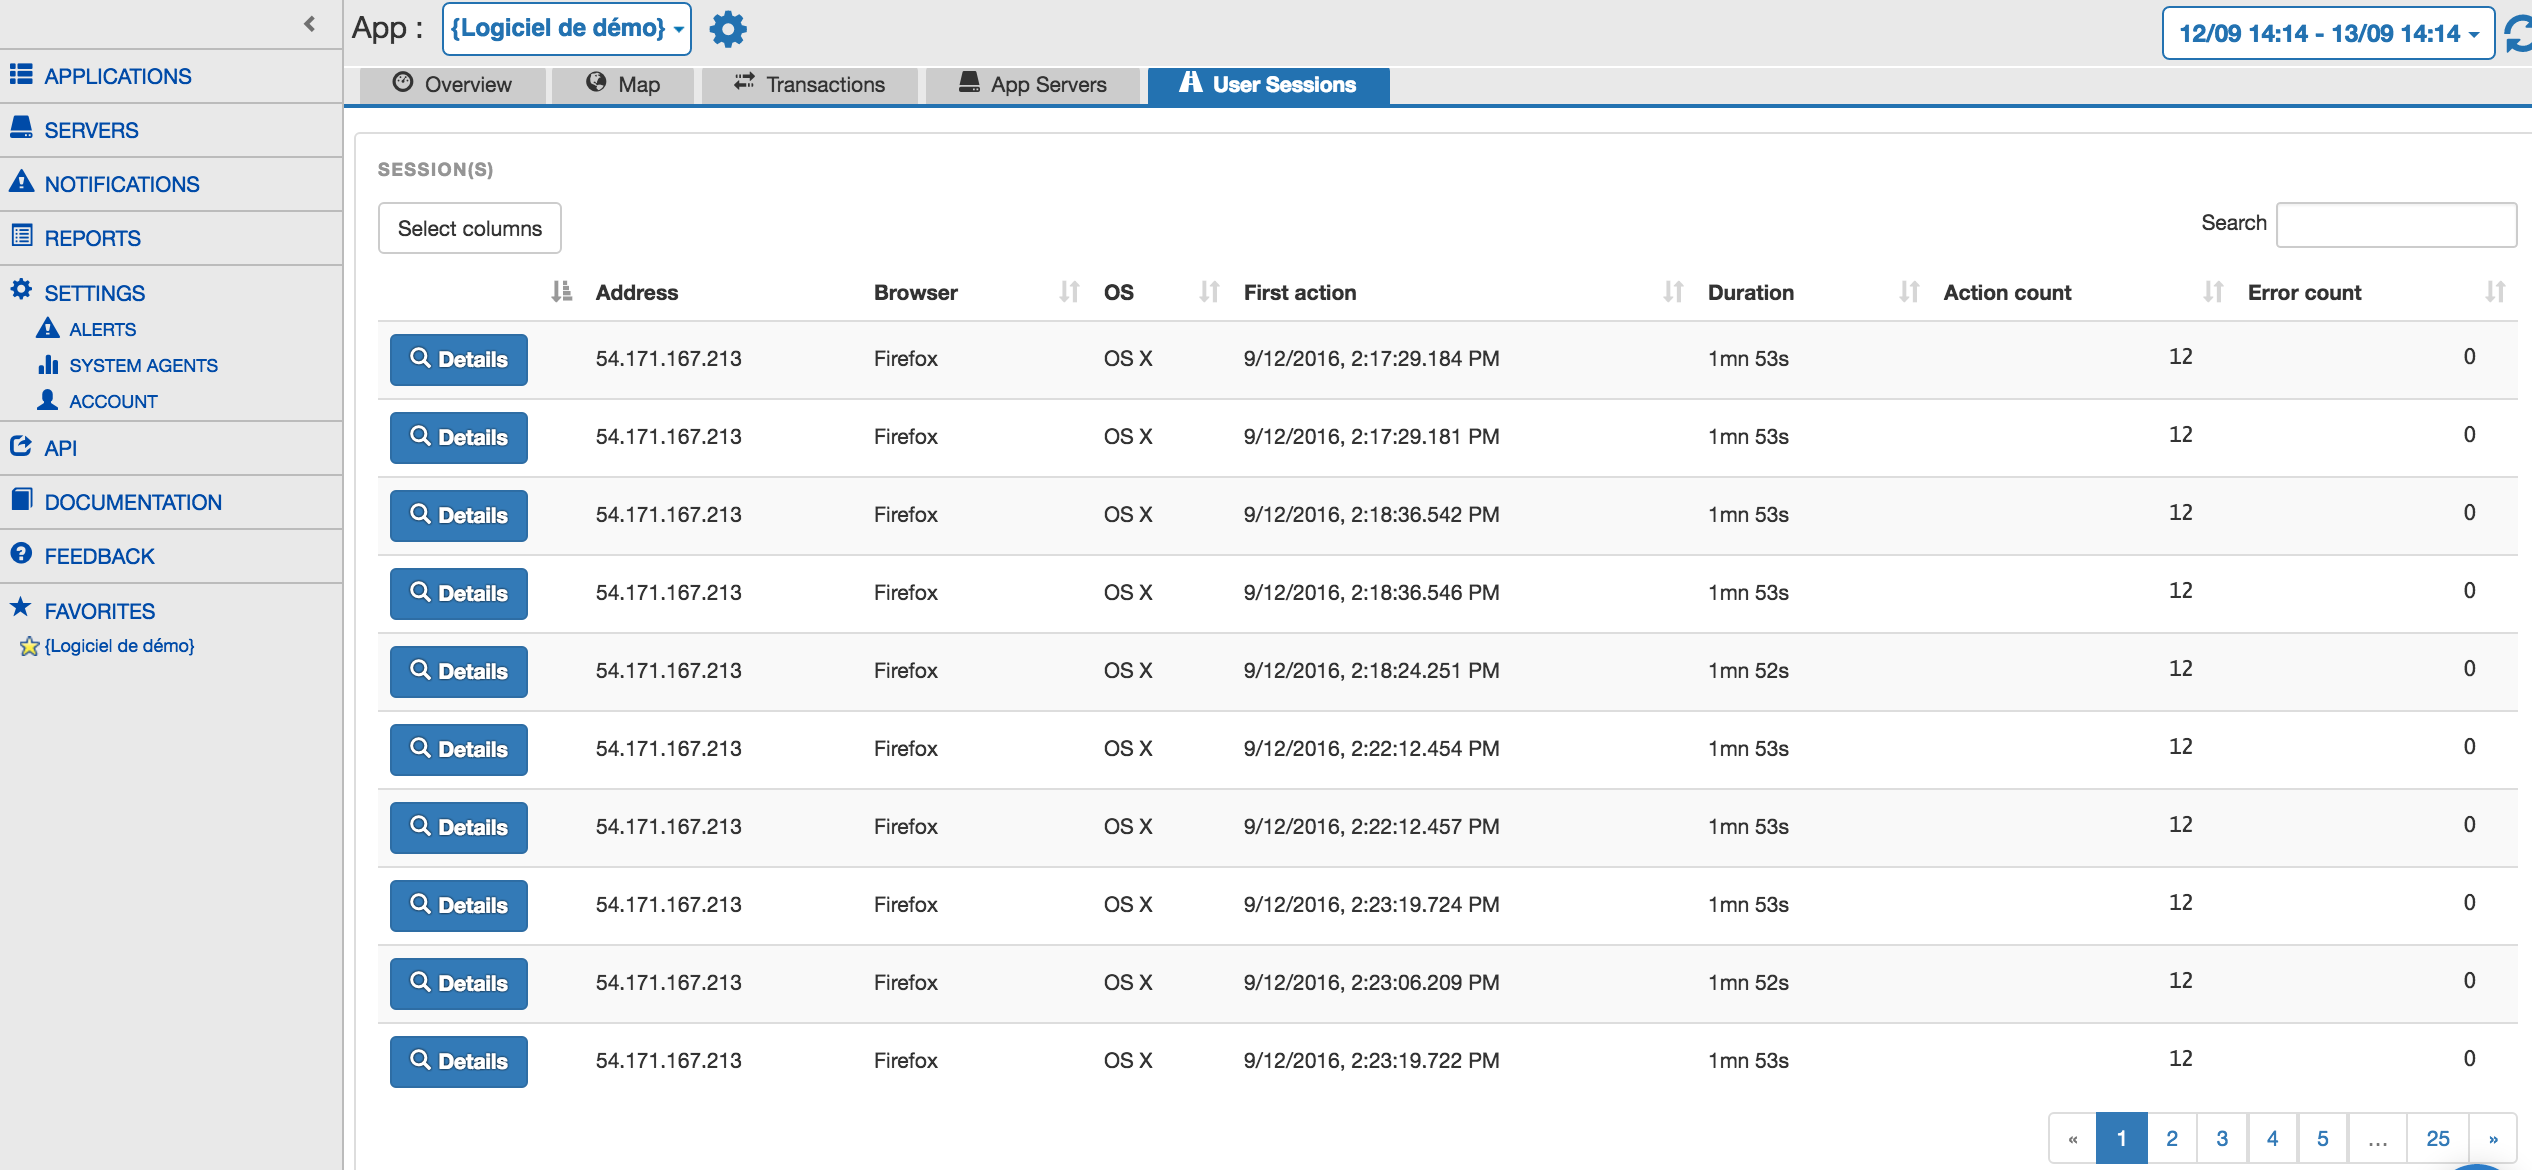
Have access to our new Key Indicators by clicking on the “User Sessions” tab:
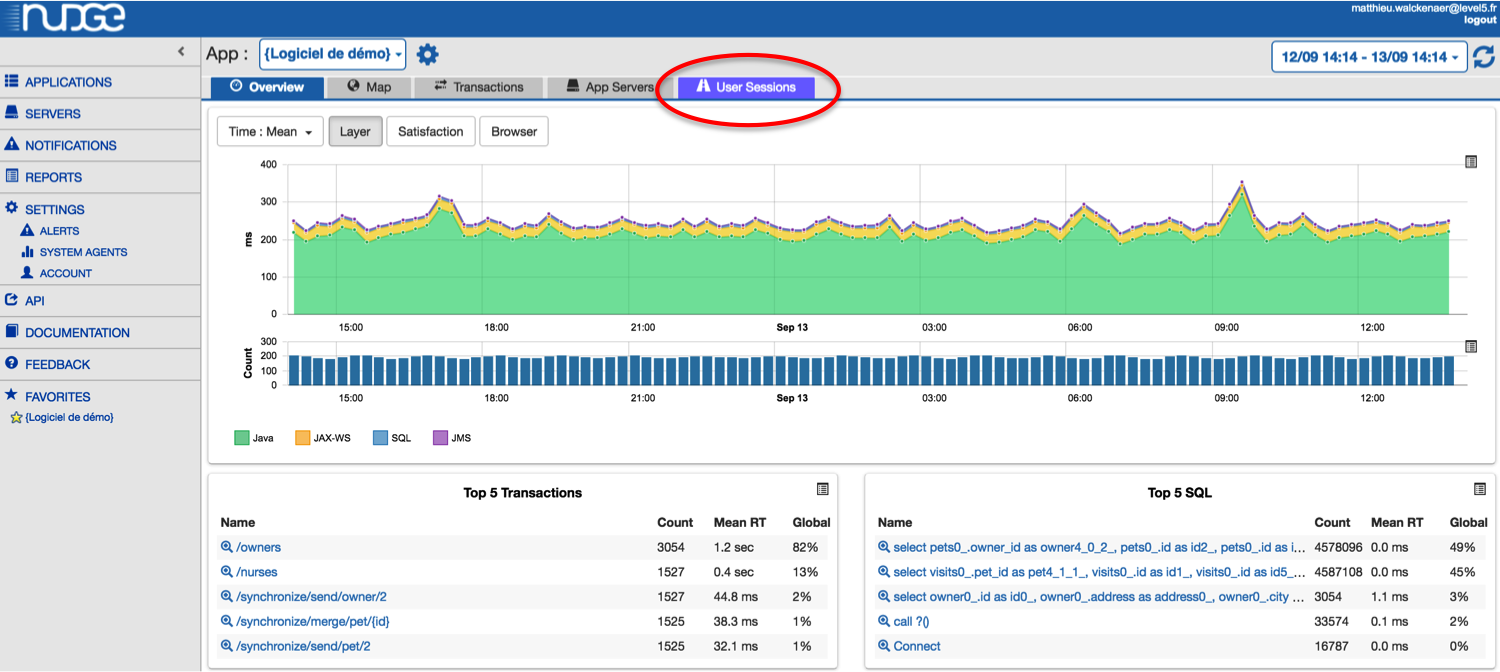
Get the users list with nice data (you can sort them) such as:
- IP address,
- Browser,
- OS,
- First action time,
- Duration,
- Action count,
- Error count,
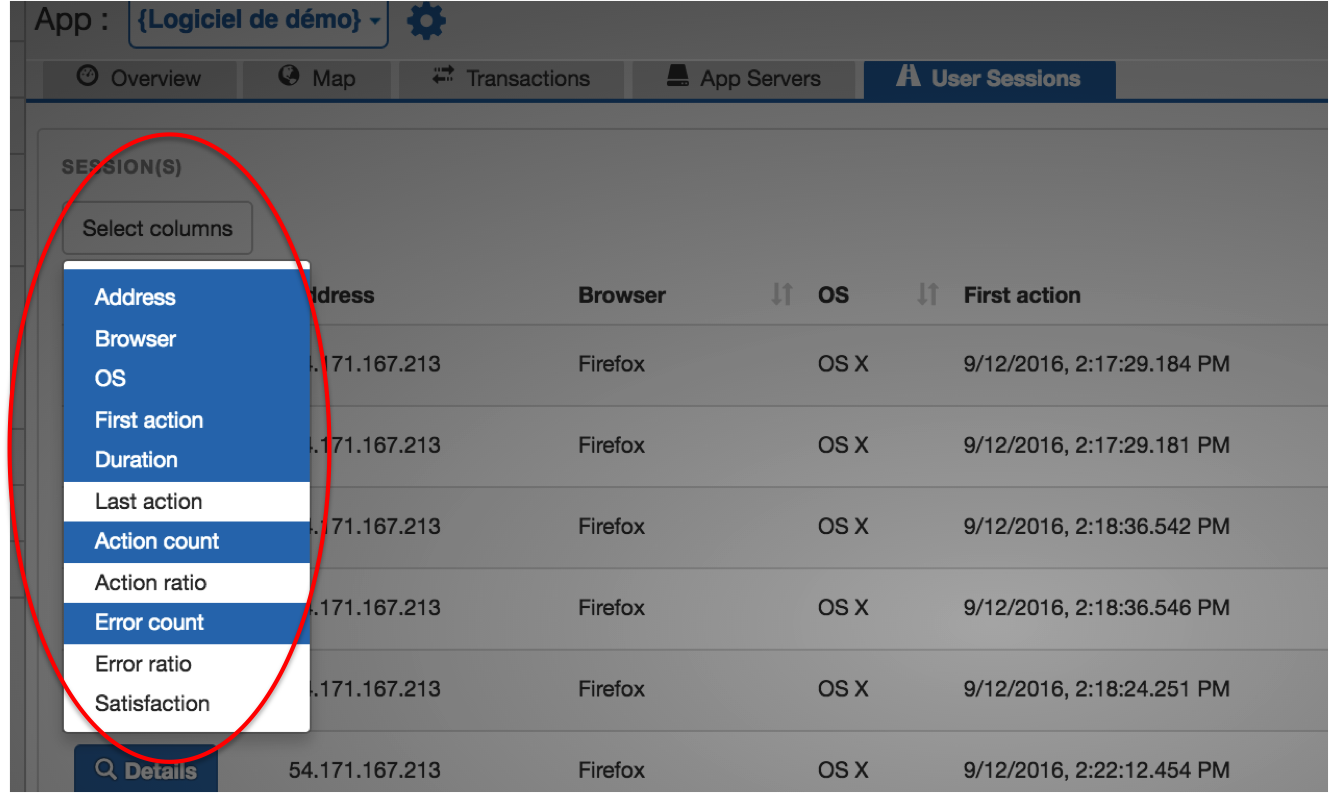
You can choose the columns you want to see or hide:
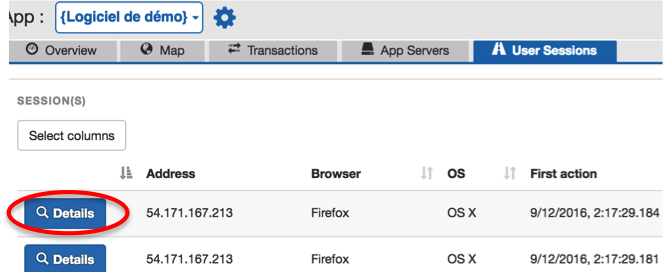
In order to analyze the behavior of a specific user, click on Details:
The user navigation will appear in a time-line, on which you can scroll horizontally and zoom. By clicking on a specific transaction, you get further details.

For each session action, you get:
- Related transaction alias (potentially tied to a filter),
- Related transaction code (initial technical name before filtering, if any),
- Satisfaction (based on configurable APDEX thresholds),
- Start and End,
- Duration,
- IP/DNS Address,
- OS,
- Browser,
- Transaction Type
You get more information on transactions with either a frustrating response time or an error.
When the transaction comes from an HTTP call, all HTTP parameters will be displayed.

You can also have a in-depth view of all calls triggered by the transaction. For each related software layer, you get a list of calls initiated by the transaction with corresponding information:
- The request or technical identifier of the call (could be a SQL request for example for an interaction with a database),
- Start and End time,
- Hit count,
- Error count,
- Total time,
- Mean time,
- Minimum time,
- Maximum time
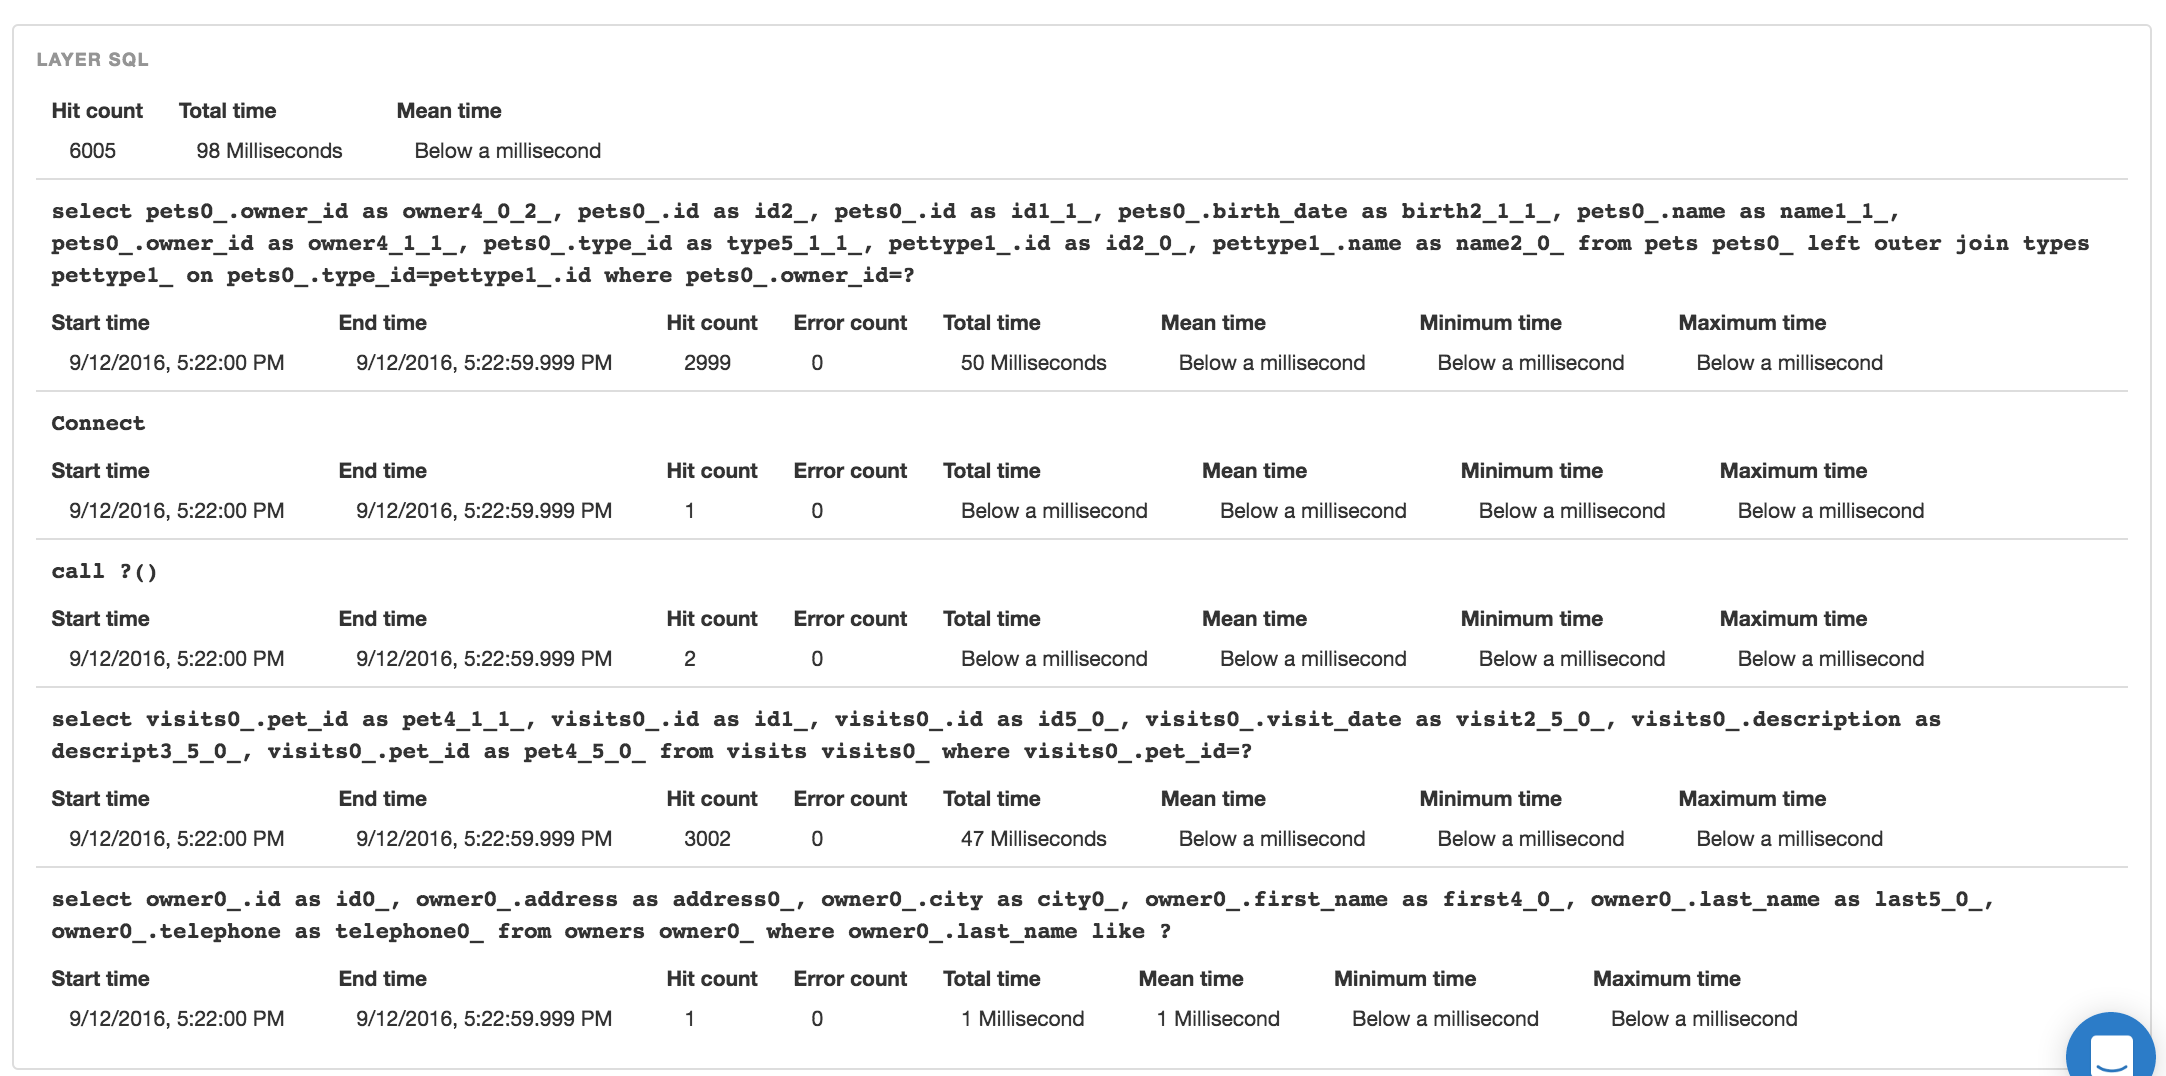
Those data are available for 1 month.
SQL monitoring
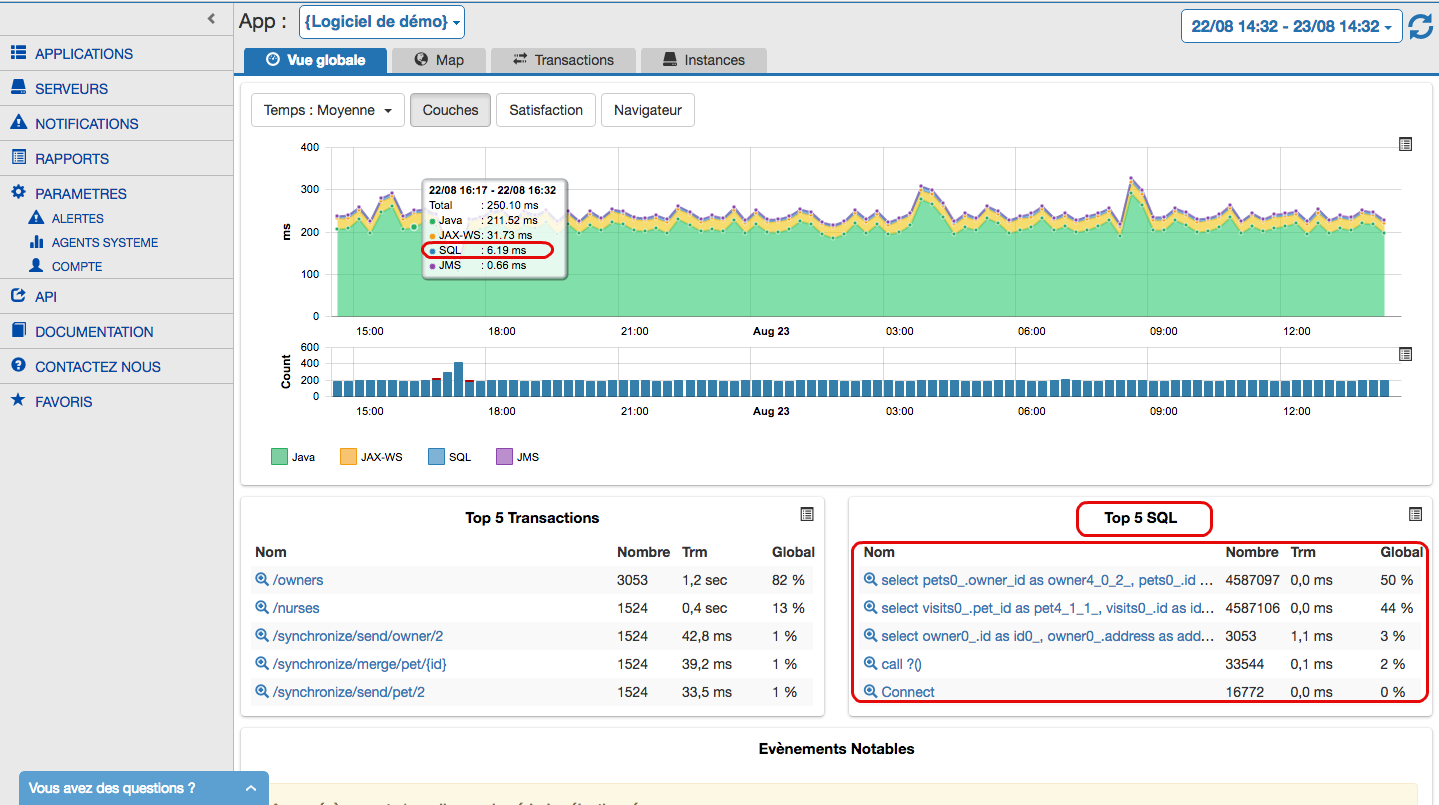
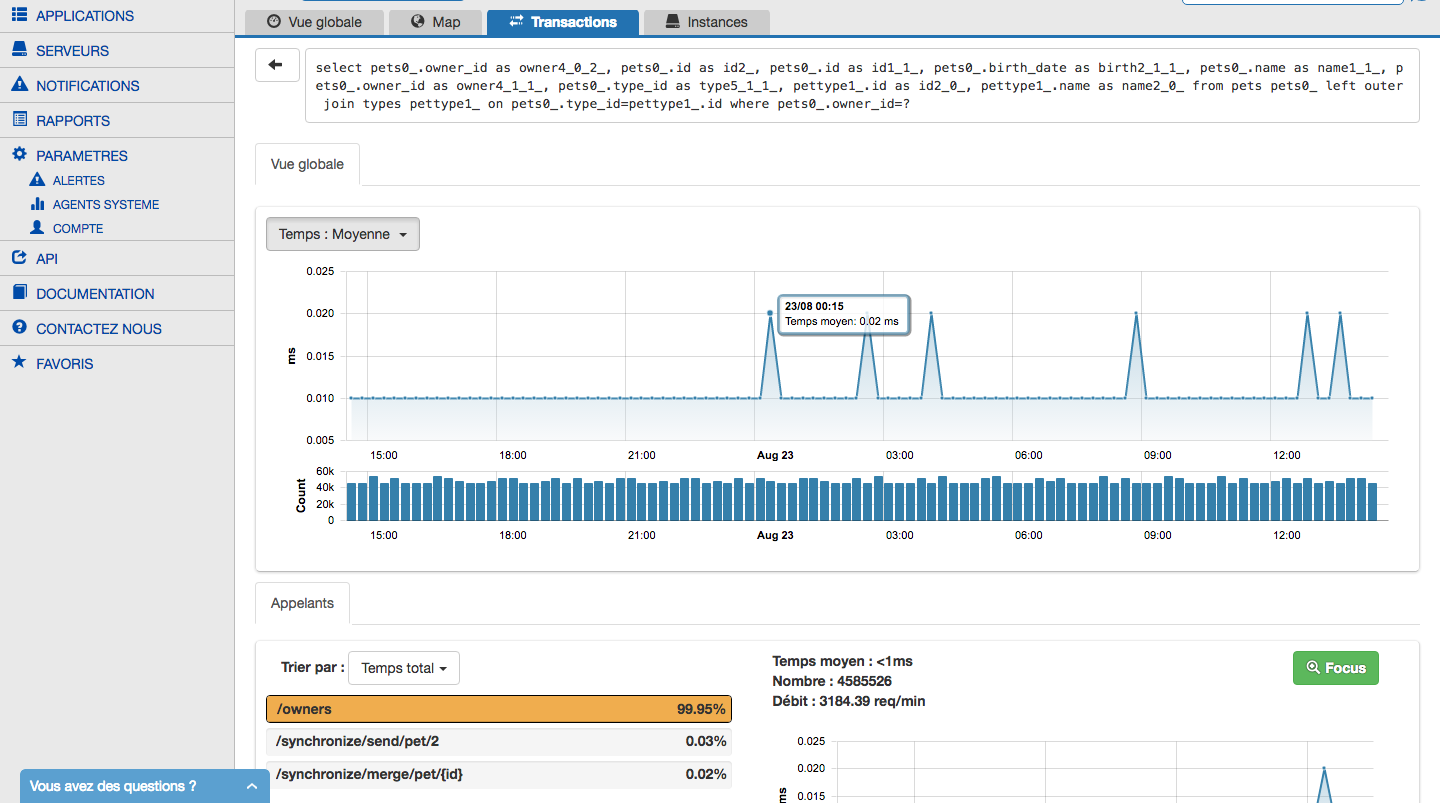
Nudge APM provides detailed following information about database interaction or connexion pools:
- slow database requests et their execution time over time
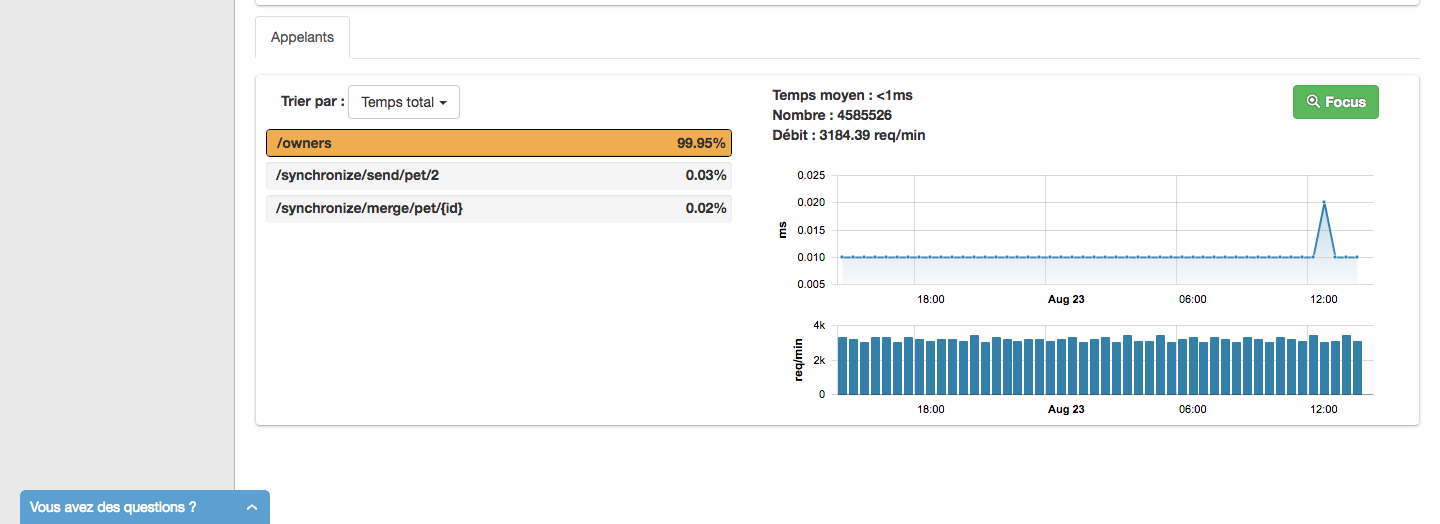
- the link between these requests and the business transactions
- the distribution of requests count over the many JVMs
The recovery of the data and the route of ResulSet can also be a cause of latencies for transactions. Also there, Nudge APM is able to supply tracks for optimization of your application (please see Java agent configuration about that subject).
- With a Java application, the agent supports automatically many database drivers, including all JDBC compliant drivers (a complete list is available here).
- With a PHP application, the agent supports automatically all PDO compliant database driver (including MySQL for exemple)
System monitoring
Synthetic system monitoring is provided by the application agents. No need to install specific agent or service to get information about host health.
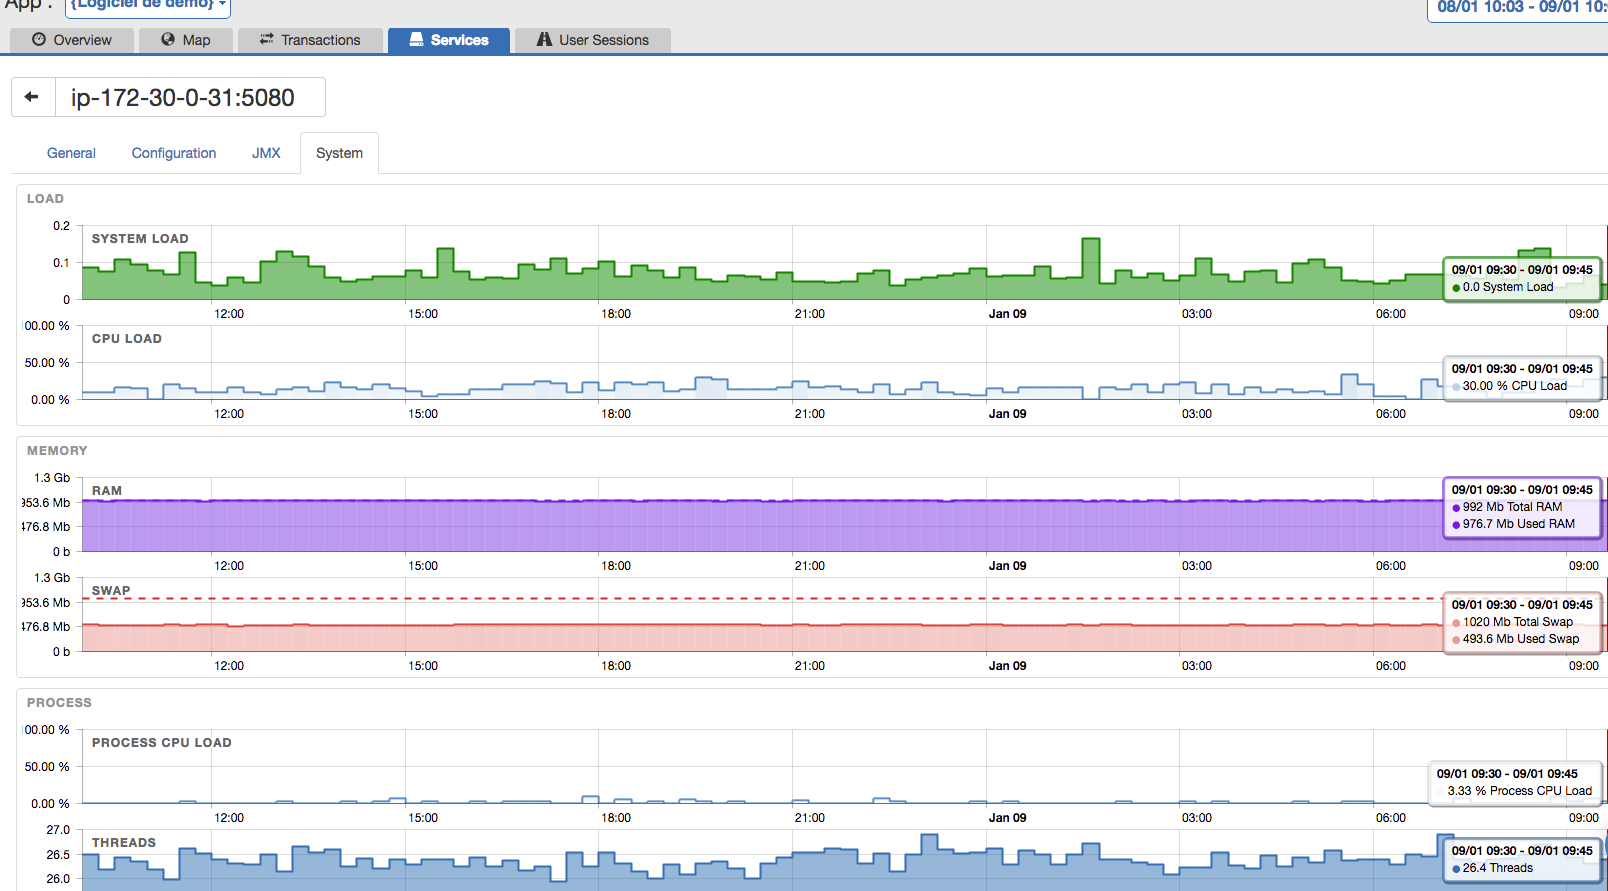
In order to activate system monitoring, please follow the documentation of corresponding agent:
- for a Java application
- for a PHP application, this monitoring is enabled by default
User Satisfaction
The Apdex measurement standard Application Performance Index allows clear definition of user satisfaction with regard to the response time.
We deal only with the ability of an application to respond quickly and the other aspects of user satisfaction will not be discussed in this section.
This measurement is computed according to response times for a set of requests over a given period of time.
APDEX thresholds
The Apdex needs 2 parameters that define the response time requirements:
-
The maximum response time beyond which the user experience is described as “tolerable”. A response time below this threshold means that the user experience is described as “satisfying”. We will call this value
'T'. -
The maximum response time beyond which the user experience is described as “frustrating”. This response time is greater than the previous parameter ‘T’. We will call this value
'F'.
APDEX formula
The Apdex is a measurement between 0 and 1, calculated based on the two above parameters.
The formula for the calculation of this measurement is as follows:
Apdex = (#Sat + (#Tol / 2)) / #Total
Where:
#Satis the number of requests whose response time is less than'T'#Tolis the number of requests whose response time is greater than'T'and less than'F'#Totalis the total number of requests. If#Fruis the number of requests whose response time is greater than'F', then we get#Total = #Fru + #Tol + #Sat.
The Apdex is therefore a weighting on the number of requests according to their response time.
Response time categories
The response time is divided into 3 categories: satisfying, tolerable and frustrating.
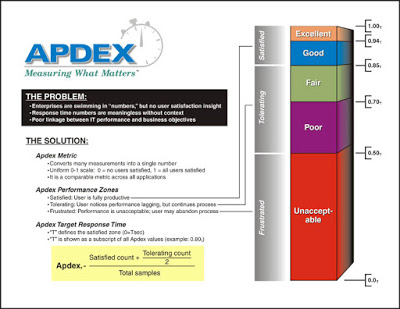
APDEX and user satifaction
The parameters 'T' and 'F' are satisfaction thresholds related to the response time.
With these thresholds and the measurements of response time, we can thus measure user satisfaction regarding the ability of the application to respond quickly.
The Apdex is a ratio with a value between 0 and 1. This way, it can be easily converted to a percentage (simply multiply by 100) to make the information easier to understand. This percentage is correlated to the number of requests through the weighting defined by the Apdex. This is not exactly a percentage of satisfactory responses but is nevertheless a percentage related to the number of certain types of responses (satisfying / tolerable / frustrating). This can be used as a reference from which the improvement or degradation of the system can be observed.

This figure from Nudge APM shows a way to represent that user satisfaction (tied with the response time of the application) over time.
Alerts
An alert is tied with a (Service Level Agreement). It allows monitor a (QoS) for an application or server.
Parameters and thresholds
An alert is defined by:
- a metric to monitor (response time, file system storage capacity, ..),
- a scope or context (one transaction, all transactions, one server, all servers, ..),
- a threshold (5 seconds, 80%, error rate, ..),
- a time range (every day between 8am and 6pm, only the weekend, ..),
- recipient(s) (list of email adresses, an URL, ..)
When a threshold is exceeded, a notification is raised and sent.
Nudge APM allows definition of an alert with a fixed threshold or with a trend.
Here are some examples:
- response time of a business transaction greater than 2 seconds on average for more than 5 minutes,
- filling a file system to over 90%,
- error rate exceeds 50% over the past week.
When an alert has arisen
Here are all consequences of the raise of an alert:
- an early warning email will be sent to the addresses configured (if recipients are defined as email addresses),
- an early warning is send by HTTP to the webhook (if a webhook is configured),
- an icon will appear on the main graph of the “Overview tab of your application,
- a message will also be visible in the Noteworthy Events panel of the “Overview tab,
- the warning will be reported in the Events tab of your application
Please take a look at the page dedicated to the configuration of an alert.
REST API
The Nudge APM REST API gives you access to all the data on the dashboard.
With the API you can:
- Collect all metrics present on Nudge APM with the desired granularity (to integrate with existing dashboards for example),
- Automate actions (create application, add users, ..),
- Manage your applications (delete application, change Apdex level of a transaction, ..)
You can access the REST API through the API button on the Nudge APM interface

You can get more information about the REST API here.
X Apps
Nudge-APM supports follow-up of transactions between two or several monitored applications. The transactions can be followed through these ; it’s what we call Cross-apps monitoring.

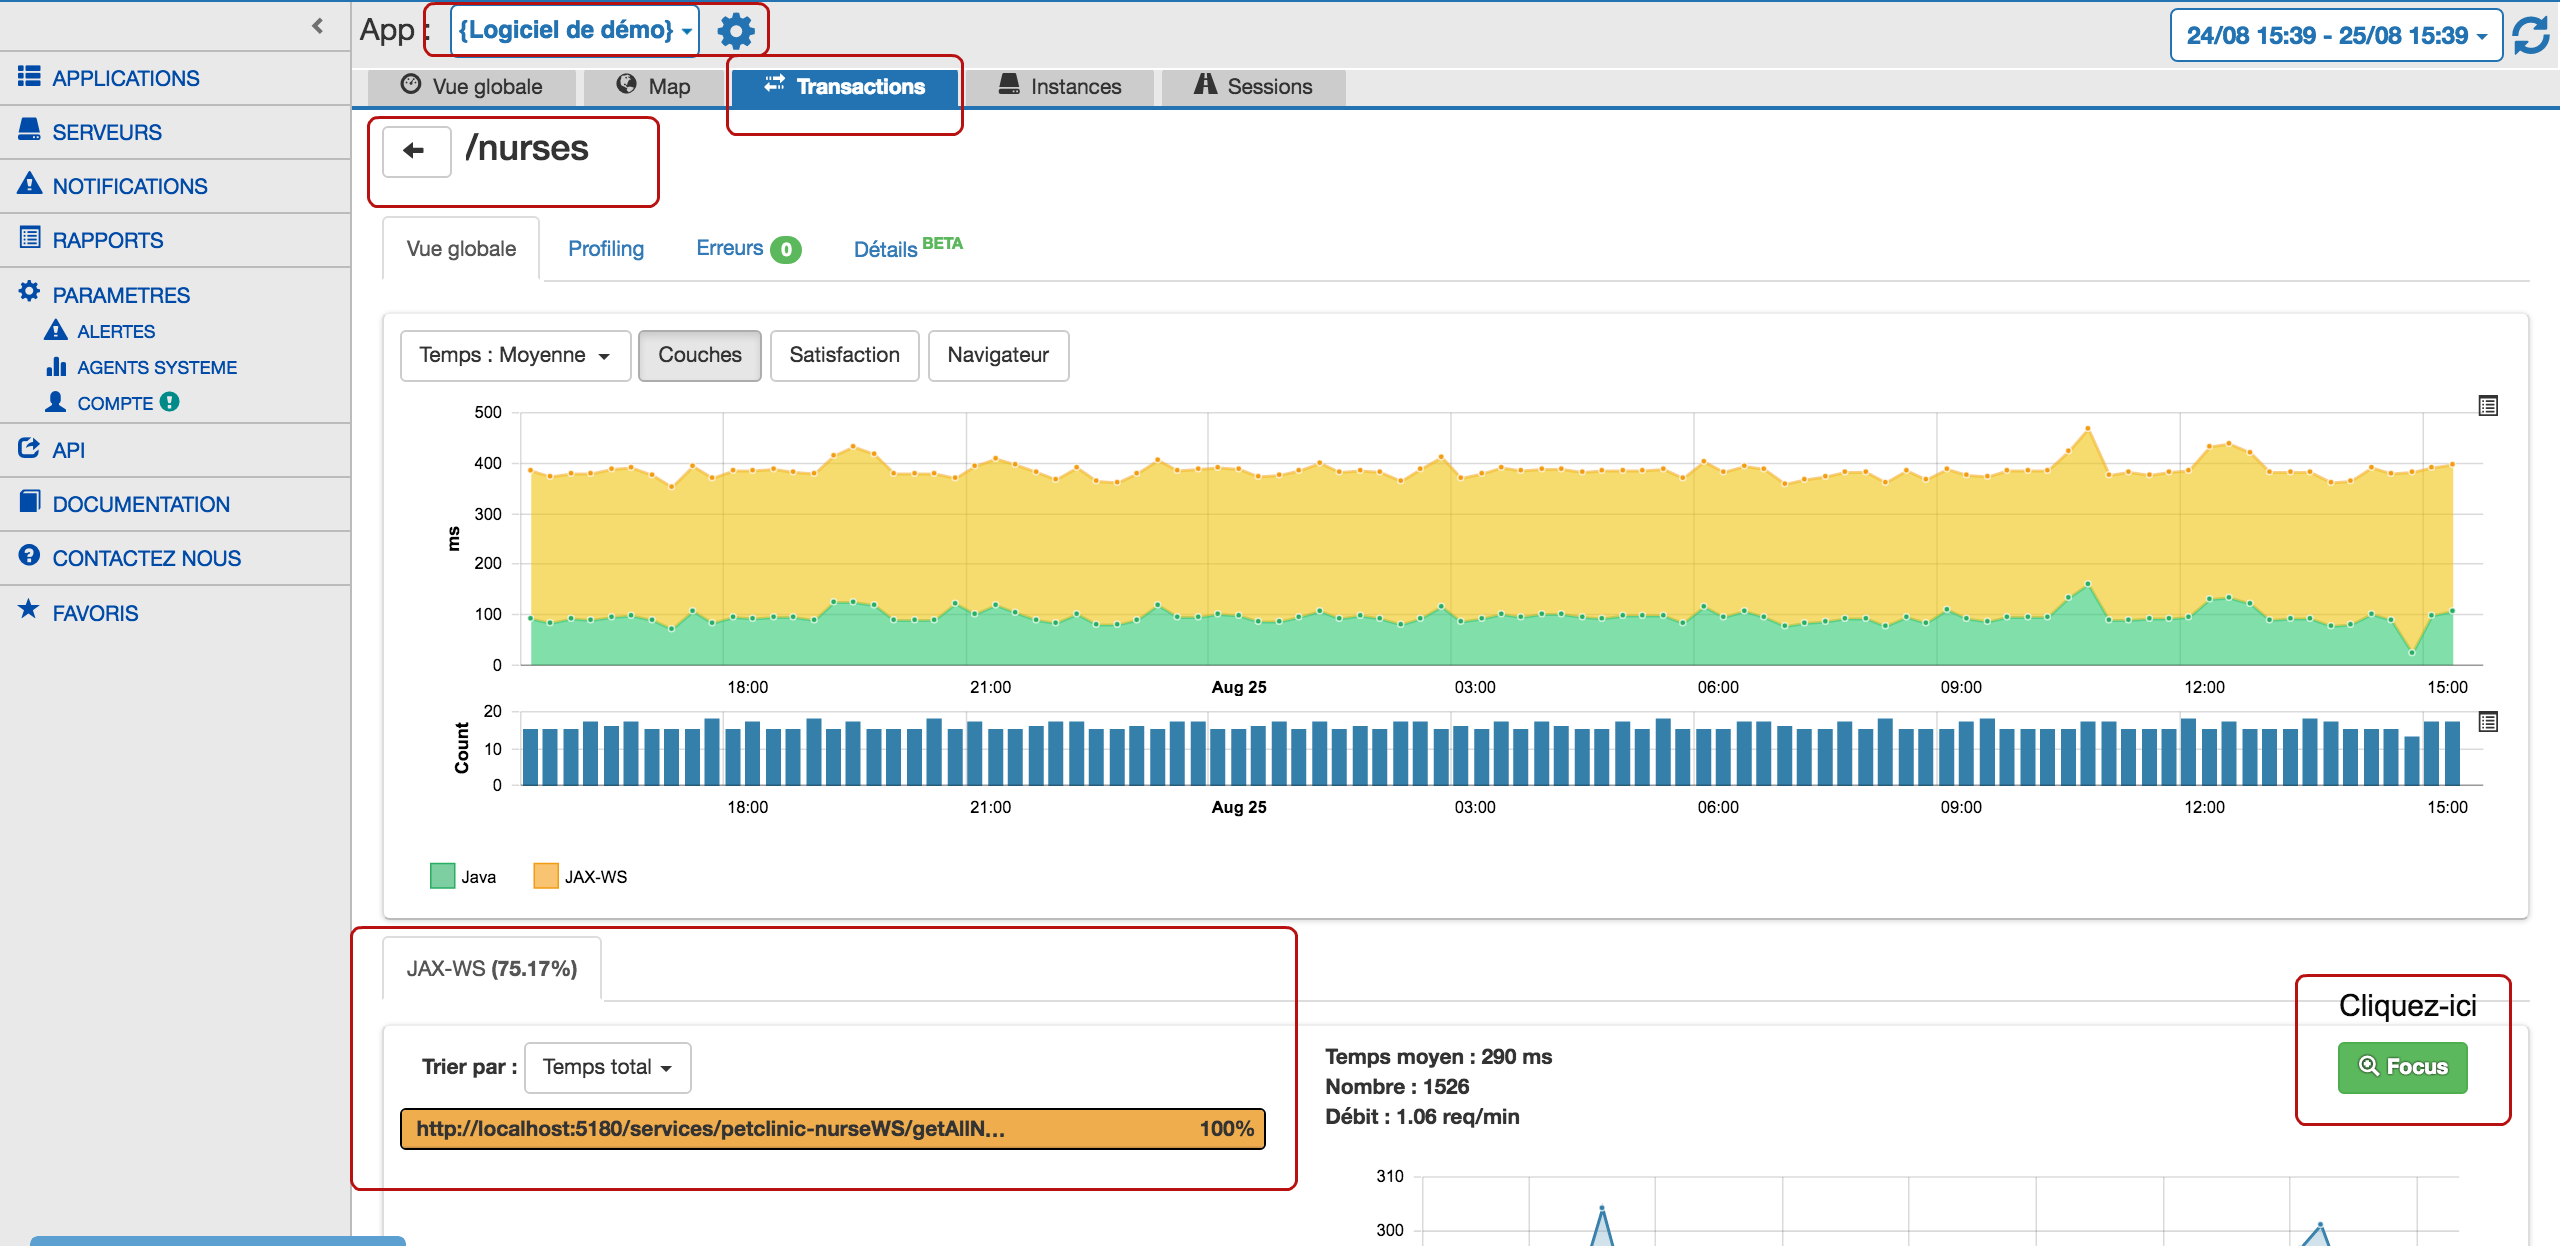
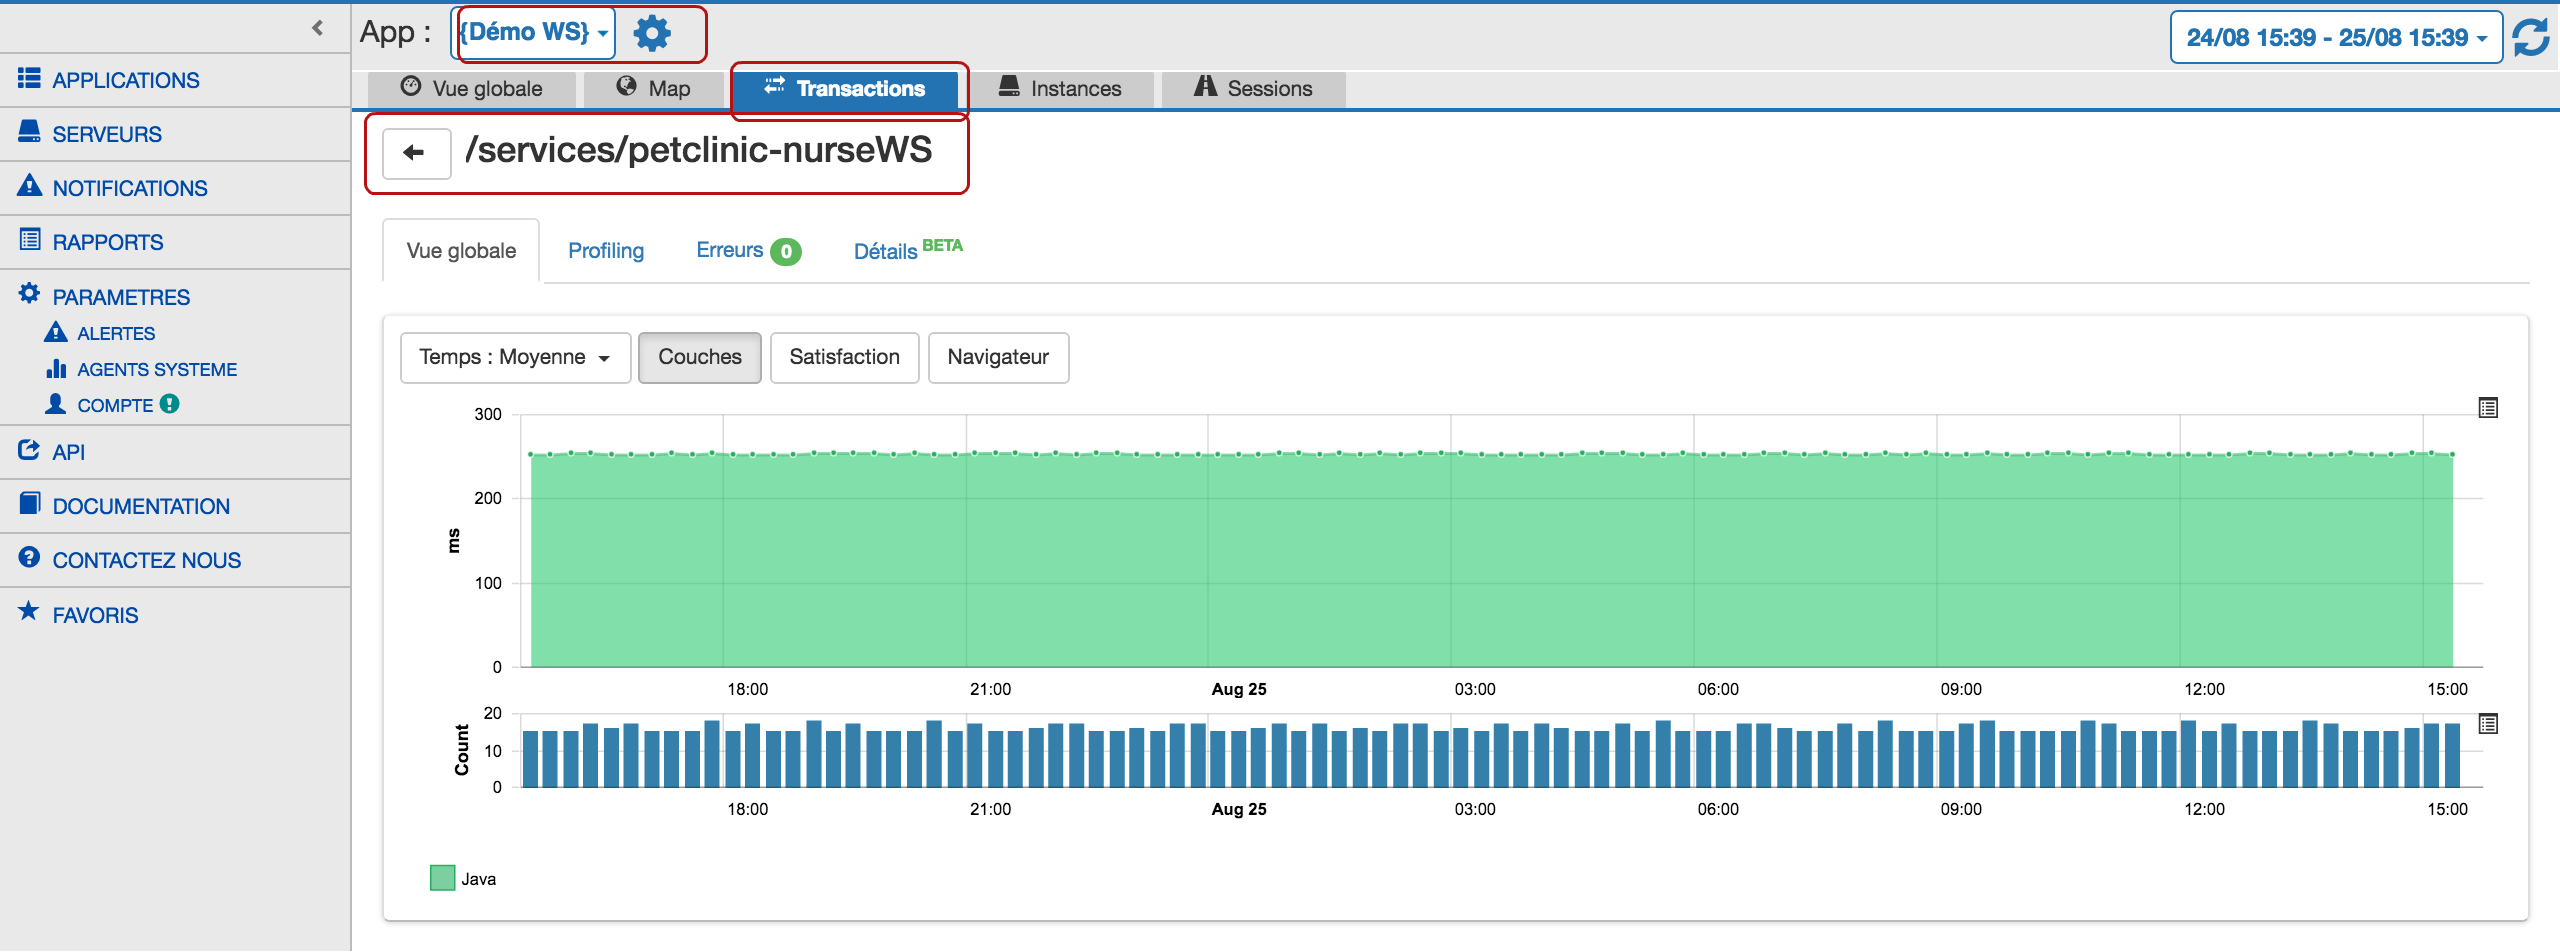
The follow-up of transactions is automatically enabled by the Java agent with many communication protocols.
Reports
With Nudge APM you can send or receive reports about the performance of your applications in production.
You can build reports using various widgets available on the platform. Reports can suit many needs of
- Developer,
- Architect,
- System administrator,
- Helpdesk,
- Devops,
- Management

You would find more information about how to configure reports here.
With an onpremises installation, you can even customize your reports (with your company’s logo for exemple).
LDAP integration
This feature is only available for an on-site (or on-premises) installation of the Nudge APM monitor.
It allows users to use their usual login and password in order to connect to the Nudge APM monitor. They will have no need to register or subscribe.
The Nudge APM monitor will be aware of users by connecting to your LDAP compatible authentication service.
You can find information about LDAP integration configuration on this page.